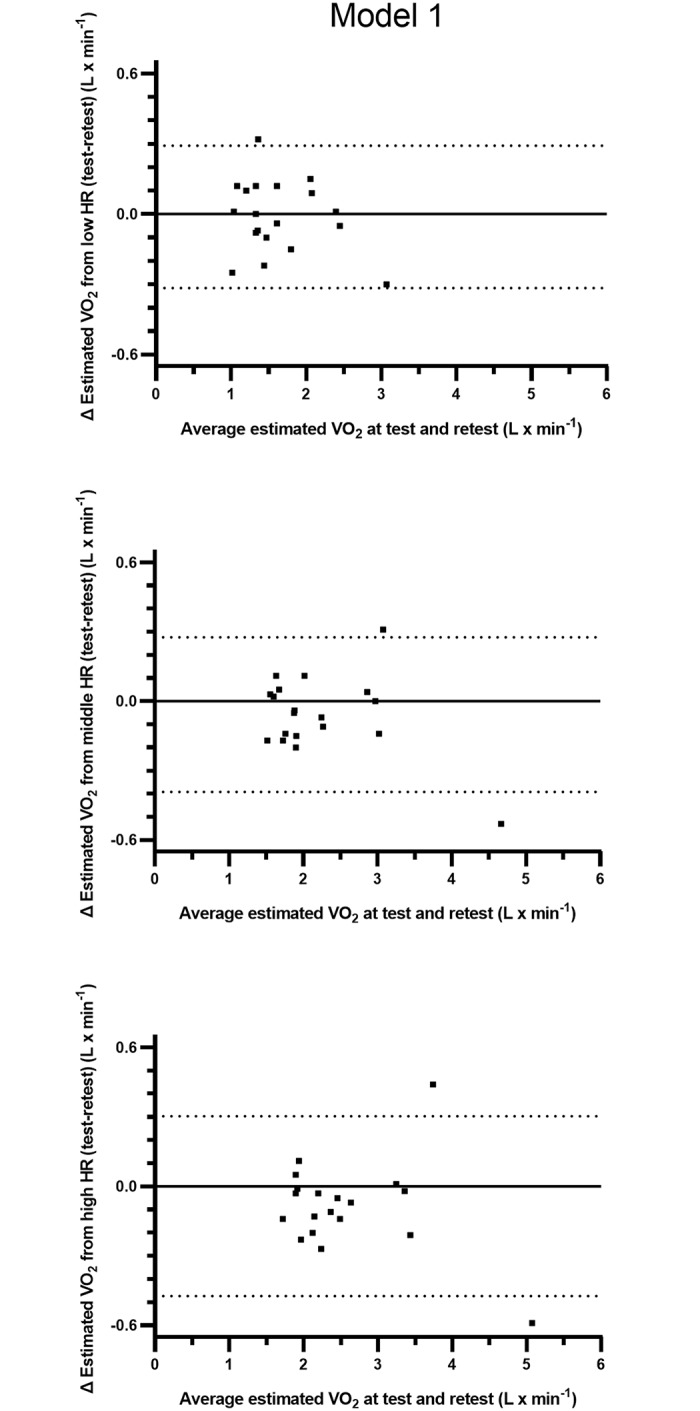
Fig 2. Individual levels of differences and the 95% limits of agreement between estimations of VO2 (L · min-1) calculated from fixed levels of low, middle and high HR from commuter cycling as well as from repeated measurements of HR-VO2 relations based on three submaximal work rates (model 1).

The y-axes show absolute differences in VO2 against the mean values of the estimations from the repeated measurements on the x-axes.
