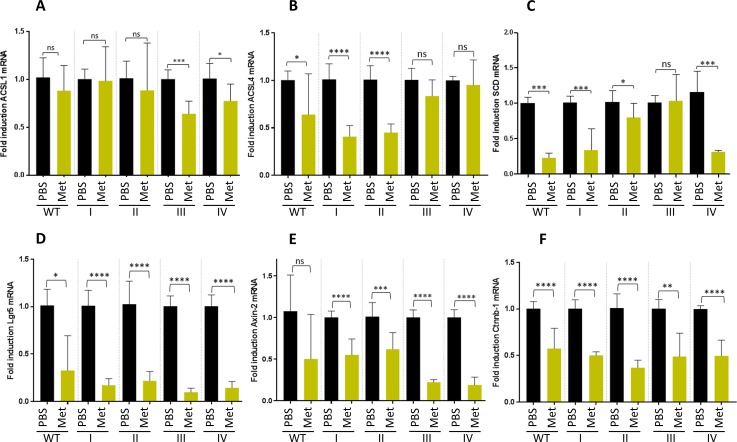
Fig 4. Metformin action is stronger on ACSL4 and SCD overexpressing first stages organoids (I & II) and downregulates the intestinal stem cell biomarker LGR5 and Wnt target genes expression in all organoid stages.
mRNA expression levels of the genes comprising the ACSL/SCD axis, ACSL1 (A), ACSL4 (B) and SCD (C), by RT-QPCR; and expression levels of different stem cell markers, LGR5 (D), Axin-2 (E) and Ctnnb-1 (F) by RT-QPCR upon PBS (black bars) and 10 mM metformin (yellow bars). Data are represented by the fold-change mean to each PBS control ±SD (n = 3). (ns, P> 0.05; *, P ≤ 0.05; **, P ≤ 0.01; ***, P ≤ 0.001; ****, P ≤ 0.0001).

