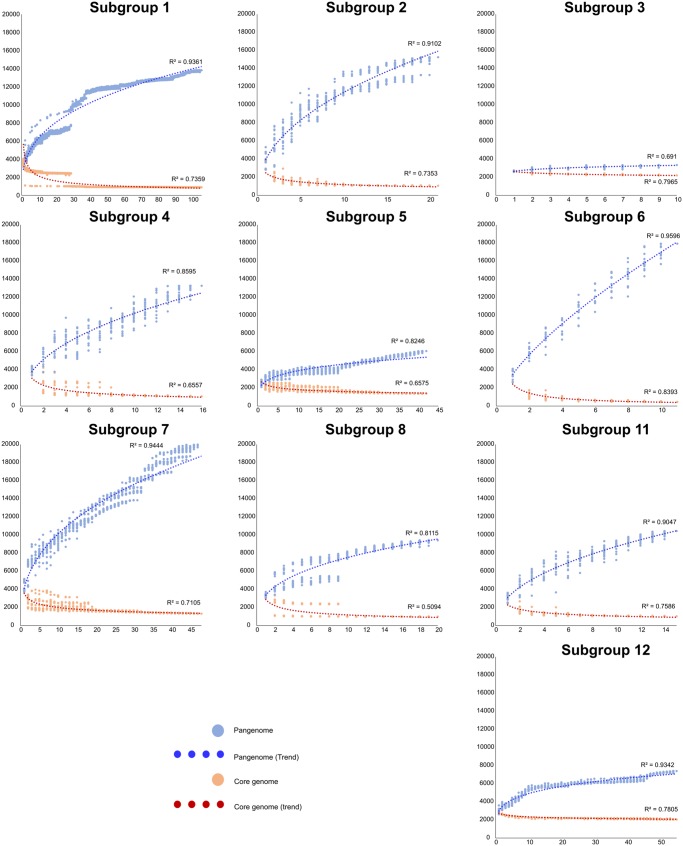
Fig. 3.
—Pangenome analysis of selected subgroups. The y axis shows the number of gene families and the x axis shows the number of genomes analyzed. The number of conserved genes was calculated by randomly adding genomes, with 20 replicates (if n > 20) or the same numbers as genomes (if n < 20). This analysis shows large differences in the genetic diversity of the subgroups, with less diversity and almost closed pangenomes in pathogenic subgroups.

