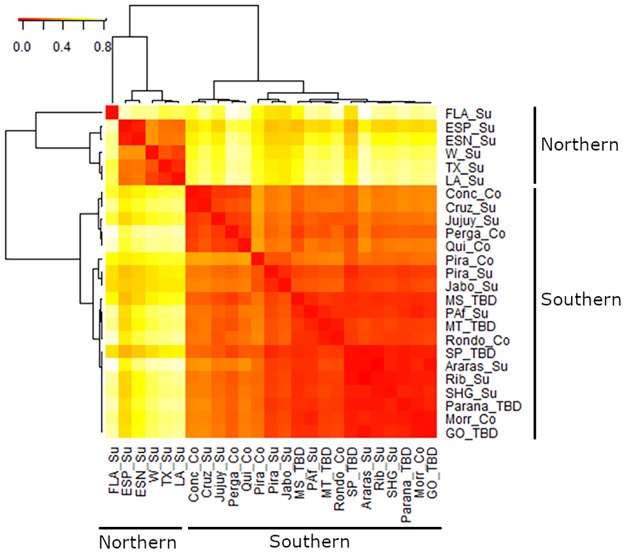
Fig 1. Heatmap of pairwise FST values between Diatraea saccharalis populations, based on 1,331 SNP loci.
Dendrograms were plotted using the unweighted-pair-group method with arithmetic mean (UPGMA). Colors indicate the degree of divergence from red (low FST values, little genetic divergence) to light yellow (high FST values, strong genetic divergence).

