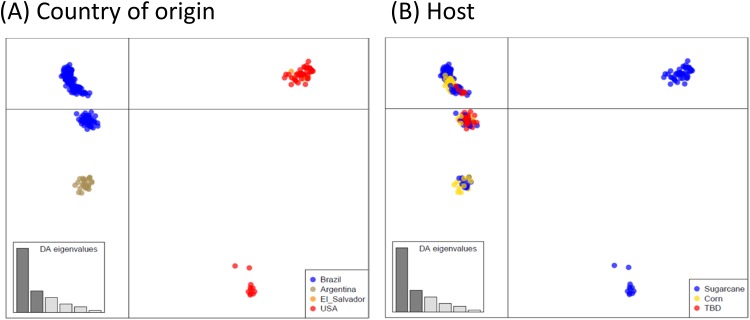
Fig 3. Scatterplots from discriminant analysis of principal components (DAPC) based on 1,331 SNP loci showing the dispersion of 250 Diatraea saccharalis individuals across the first two principal components.
Individuals (dots) are colored according to (A) their country of origin; and (B) the host crop in which they were collected. Variation represented in x = 44.4% and in y = 15%.

