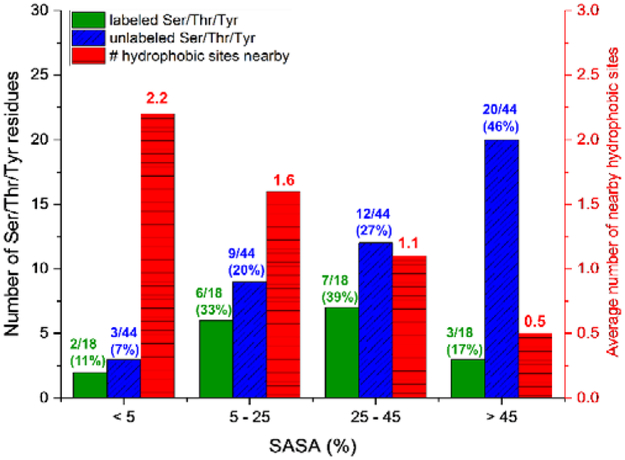
Figure 4.

Histograms illustrating the distribution of %SASA values for both labeled (green) and unlabeled (blue) Ser, Thr, and Tyr residues in the proteins β2m, ubiquitin, and hGH. (See left axis.) Also included is the distribution of the average number of nearby hydrophobic sites (red) per Ser/Thr/Tyr residue in each bin of SASA values. (See right axis.)
