
Figure 3.
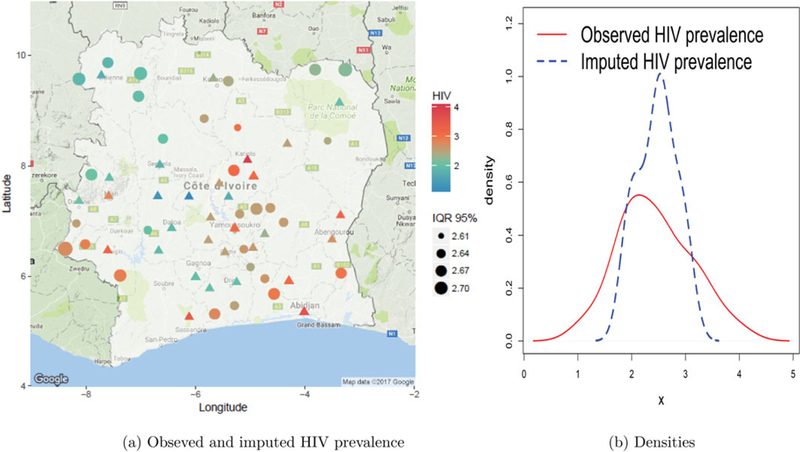
HIV imputation: plots of (a) predicted and observed HIV, where Δ represents observed data, • denotes predictions, and IQR 95% is the 95% inter-quantile range of predictions, that is, width of the 95% credible interval; and (b) overall densities of observed and imputed HIV prevalences