
Figure 7.
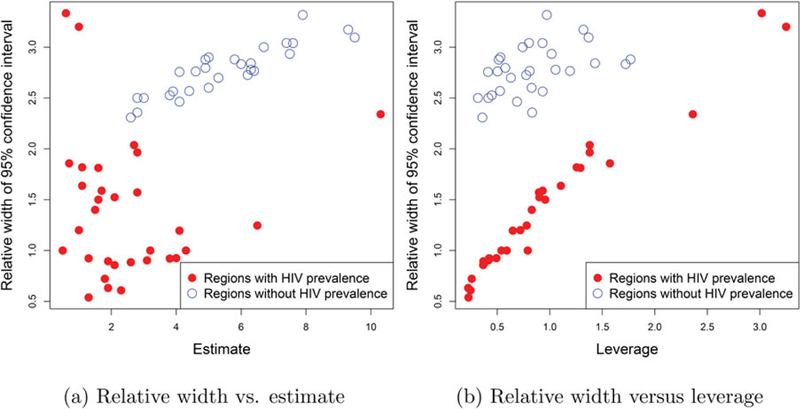
Impact of imputing HIV on uncertainty: Plots of (a) relative 95% CI widths versus estimates and (b) relative 95% CI widths versus the leverages. Red and blue dots correspond to, respectively, areas with and without HIV prevalence
Official websites use .gov
A
.gov website belongs to an official
government organization in the United States.
Secure .gov websites use HTTPS
A lock (
) or https:// means you've safely
connected to the .gov website. Share sensitive
information only on official, secure websites.
Impact of imputing HIV on uncertainty: Plots of (a) relative 95% CI widths versus estimates and (b) relative 95% CI widths versus the leverages. Red and blue dots correspond to, respectively, areas with and without HIV prevalence