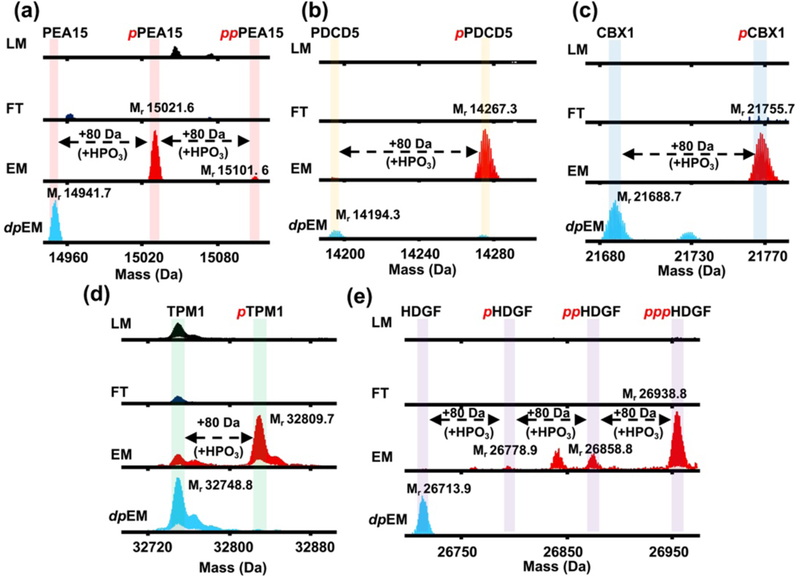
Figure 5.

Top-down MS analysis of representative endogenous phosphoproteins specifically enriched from a highly complex human cardiac tissue homogenate. Deconvoluted spectra of (a) astrocytic phosphoprotein 15 (PEA15), (b) programmed cell death protein 5 (PDCD5), (c) chromobox protein homolog 1 (CBX1), (d) tropomyosin alpha (TPM1), and (e) hepatoma derived growth factor (HDGF). Equal total protein amount (5 μg) of the loading mixture (LM), flow-through (FT), elution mixture after enrichment (EM), and elution mixture post enrichment with additional dephosphorylation step using alkaline phosphatase (dpEM) was used for the MS analysis. Phosphorylation is indicated by a red “p”. Mr: monoisotopic mass. Mass difference of 80 Da corresponds to covalent addition of a phosphate group (+HPO3). All deconvoluted spectra corresponding to a particular protein were normalized.
