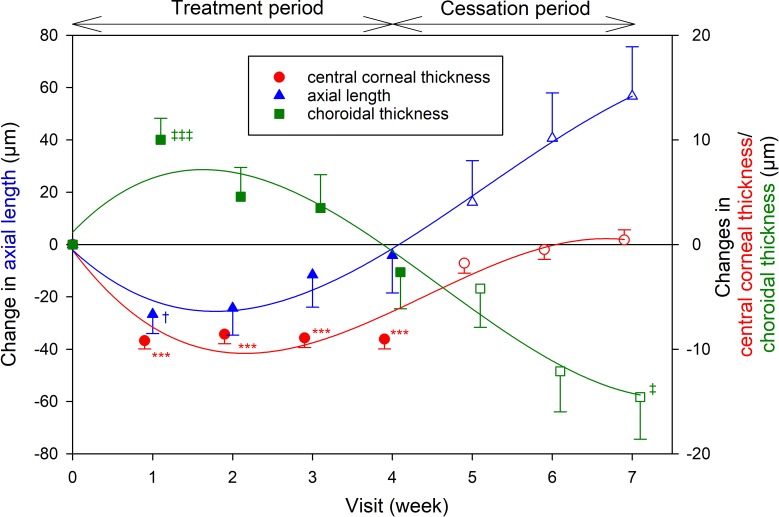
Figure 2.
Mean change in central corneal thickness (red circles), axial length (blue triangles), and choroidal thickness (green squares) compared with baseline during the treatment (weeks 1–4, filled symbols) and the cessation (weeks 5–7, empty symbols) periods, adjusted for paired-eye data. Solid lines represent the regression lines of the means. Left y-axis: changes in axial length; right y-axis: changes in central corneal thickness and choroidal thickness. The data have been separated along the x-axis at each time point to aid visualization. Each error bar represents 1 SEM. † or ‡: P < 0.05; *** or ‡‡‡: P < 0.001.

