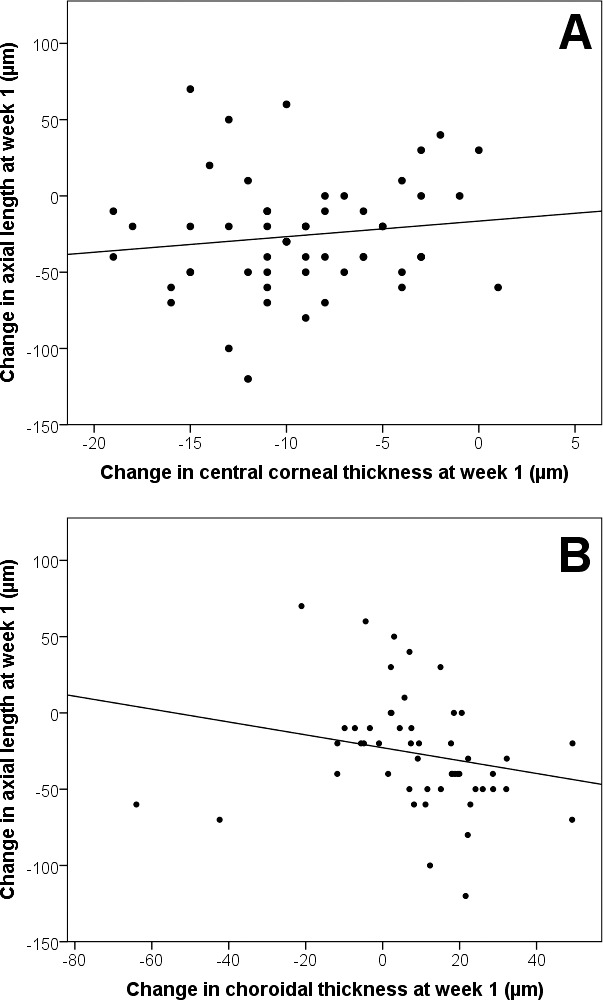
Figure 3.

Scatterplots showing the relationships between (A) changes in central corneal thickness (β = 4, P = 0.02) and (B) changes in choroidal thickness (β = −2, P < 0.001), against changes in axial length at week 1, after adjusting for sex and paired-eye data.
