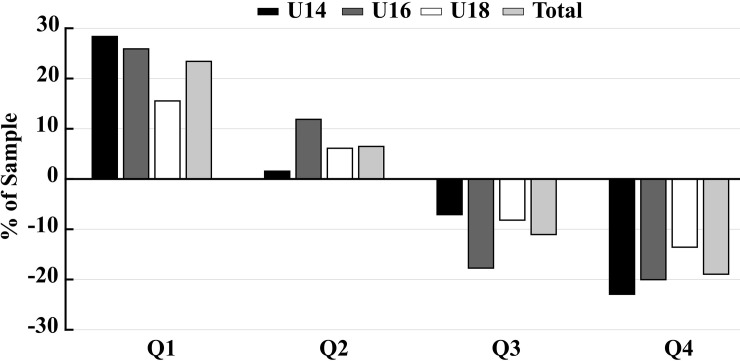
Fig 1. Differences in the birth-date distributions between the general population and our sample is shown in this figure.
The zero value corresponds to the Spanish population’s birth-date distribution for each age-category, and overall. Thus, positive values indicate over-representation of players born at the quarter, whereas negative values indicate under-representation of players born at the quarter, compared to the population’s birth-date distribution. Abbreviations: U14 = under 14 age-category; U16 = under 16 age-category; U18 = under 18 age-category; Q = quarter of the year.

