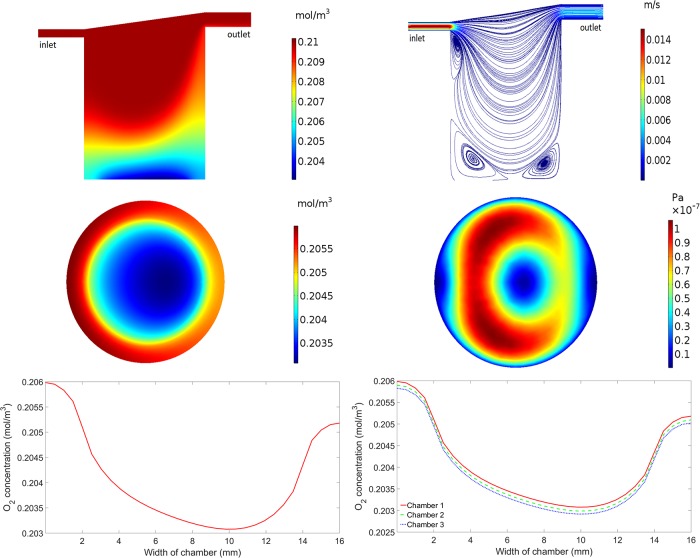
Fig 2. Simulation results for cells at the base of the chamber.
Upper left: Oxygen concentration in chamber 1. Upper right: Flow profile in chamber 1. Middle left: Oxygen concentration at the base of chamber 1. Middle right: Magnitude of the shear stress at the base of chamber 1. Lower left: Oxygen concentration across the centre of the base of chamber 1. Lower right: Oxygen concentration across the centre of the base of chambers 1, 2 and 3.

