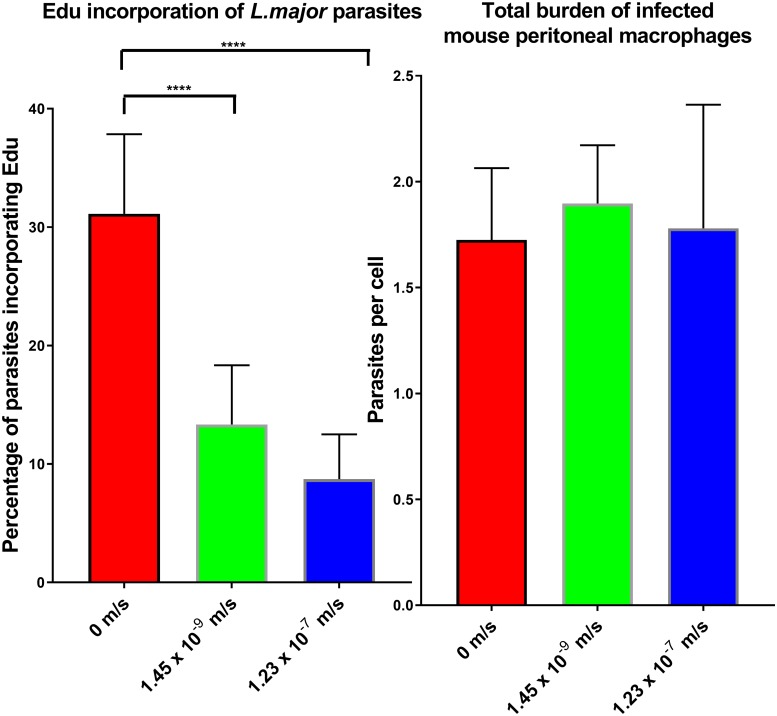
Fig 7.
Left: Bar graph showing percentage of L. major amastigotes that incorporated the EdU marker into DNA at the three different conditions, static (0m/s), low flow (1.45 x 10⁻⁹ m/s) and high flow (1.23 x 10⁻⁷ m/s). Right: Bar graph showing parasite burden in mouse peritoneal macrophages, at the three conditions. * = p<0.05 N = 3.

