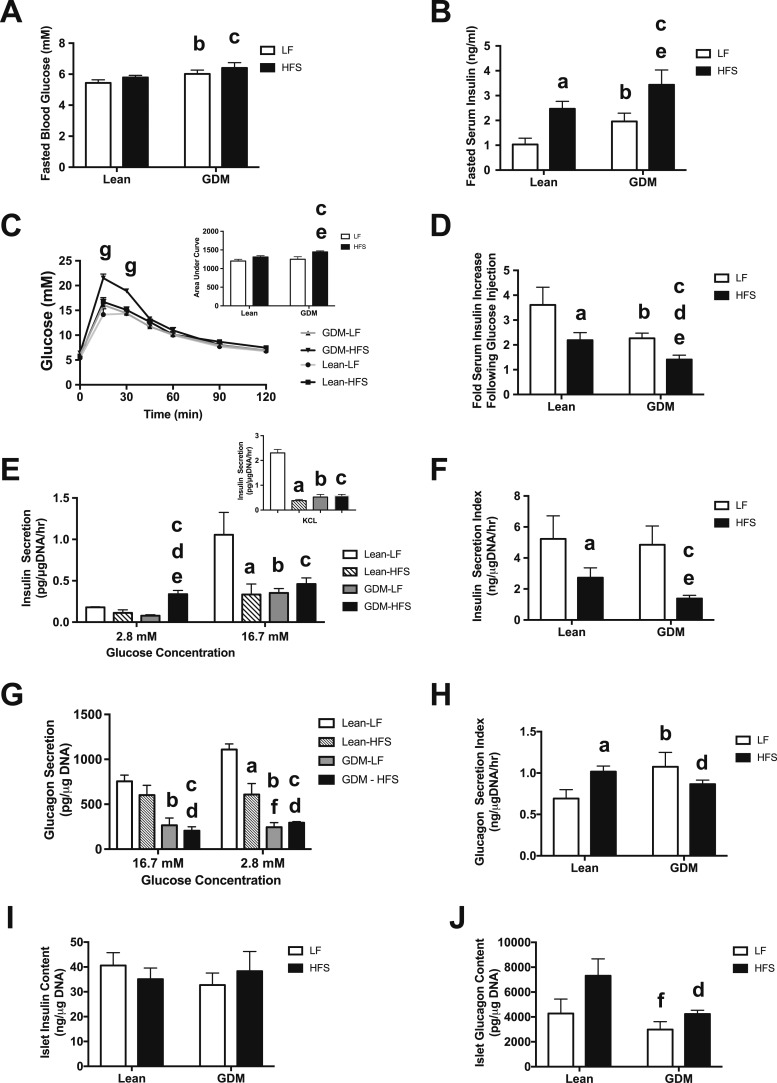
Figure 4.
Dysregulation of insulin and glucagon secretion in islets from 15-wk-old offspring of GDM dams. (A) Fasting blood glucose levels. (B) Fasting plasma insulin levels. (C) Glucose tolerance test; area under the curve (inset). (D) Insulin levels 30 min following IP glucose administration (2 g/kg body weight). (E) Ex vivo insulin secretion by isolated islets in low-glucose (2.8 mM) and high-glucose (16.7 mM) conditions; KCl (300 mM) stimulated insulin secretion (inset). (F) Glucose-stimulated insulin secretion (insulin secretion index) in islets. (G) Ex vivo glucagon secretion by isolated islets in low-glucose (2.8 mM) and high-glucose (16.7 mM) conditions. (H) Glucose inhibition of glucagon secretion (glucagon secretion index) in islets. (I) Total islet insulin content. (J) Total islet glucagon content. Data are mean ± SEM (n = 6 by group). The HFS diet included 45% fat (4.73 kcal/g); the LF diet included 10% fat (3.85 kcal/g). aP < 0.05, Lean-LF vs Lean-HFS; bP < 0.05, Lean-LF vs GDM-LF; cP < 0.05, Lean-LF vs GDM-HFS; dP < 0.05, Lean-HFS vs GDM-HFS; eP < 0.05, GDM-LF vs GDM-HFS; fP < 0.05, Lean-HFS vs GDM-LF using a two-way ANOVA followed by a Bonferroni posttest. gP < 0.05, comparing GDM-HFS offspring vs all other offspring groups, as calculated by a two-way repeated measures ANOVA with a Bonferroni posttest.

