Figure 5.
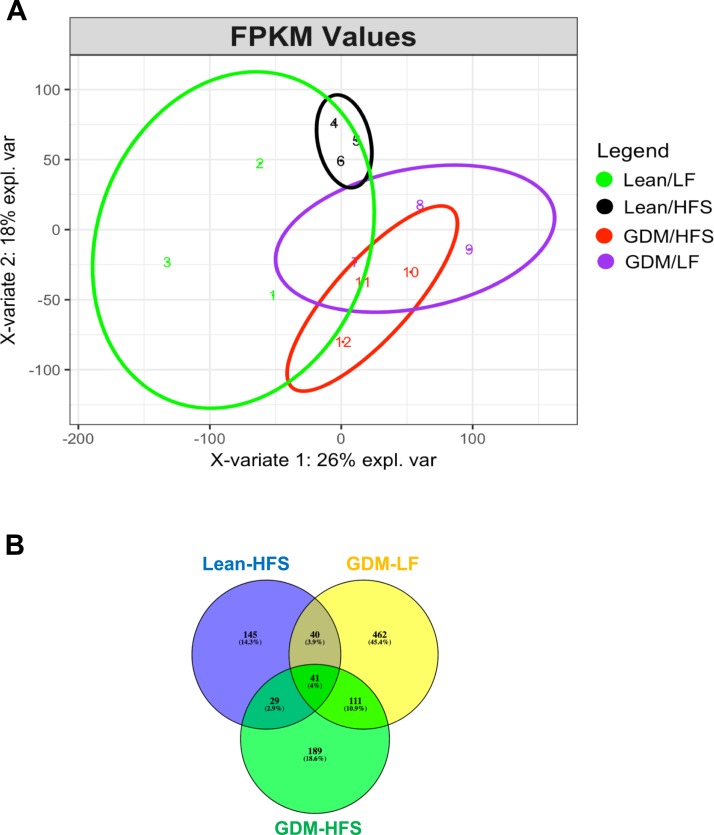
(A) The PLS-DA plot of the RNA-seq samples using the fragments per kilobase of transcript per million mapped reads (FPKM) values. This plot shows that the Lean-HFS group is closely related to the Lean-LF group, and the GDM-LF group is closely related to the GDM-HFS group. Overall, the GDM animals are separate from the lean animals, demonstrating the influence of the maternal environment on the data. (B) Venn diagram showing genes that are significantly different (more than 2-fold changes or fewer than −2-fold changes) in the three groups of offspring compared with the Lean-LF offspring.

