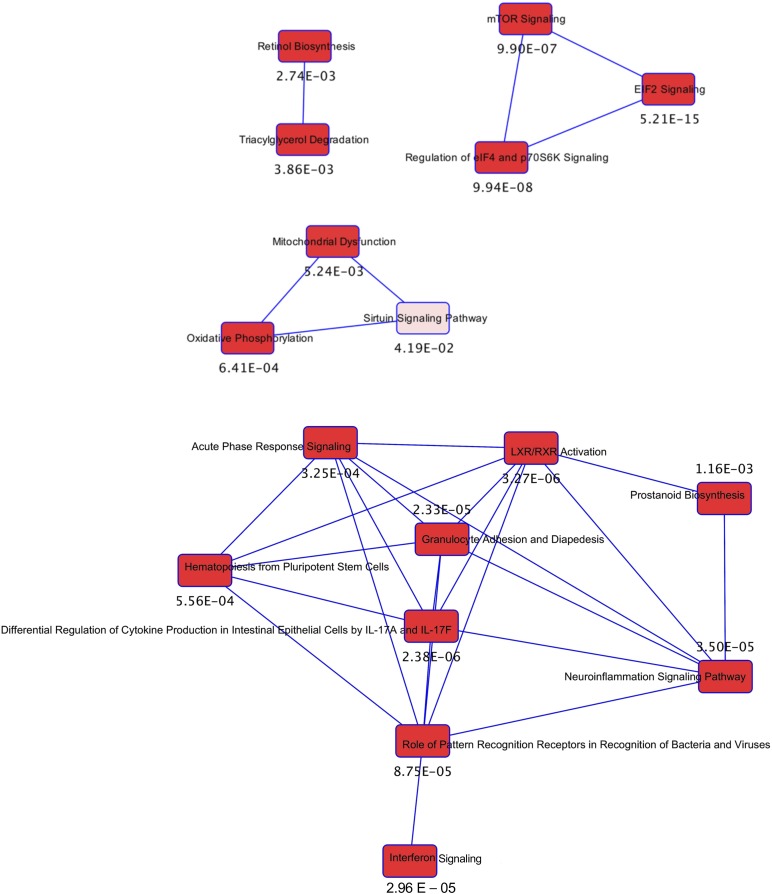
Figure 8.
The interaction between differentially regulated transcriptional networks from the Ingenuity Pathway Analysis of rat islet mRNA from the offspring of GDM dams. Each pathway as a single node is colored proportionally to the Fisher exact test P value (numeric value adjacent to the node) where darker red indicates greater significance. A line connects two pathways when at least one data-set molecule is common between pathways.

