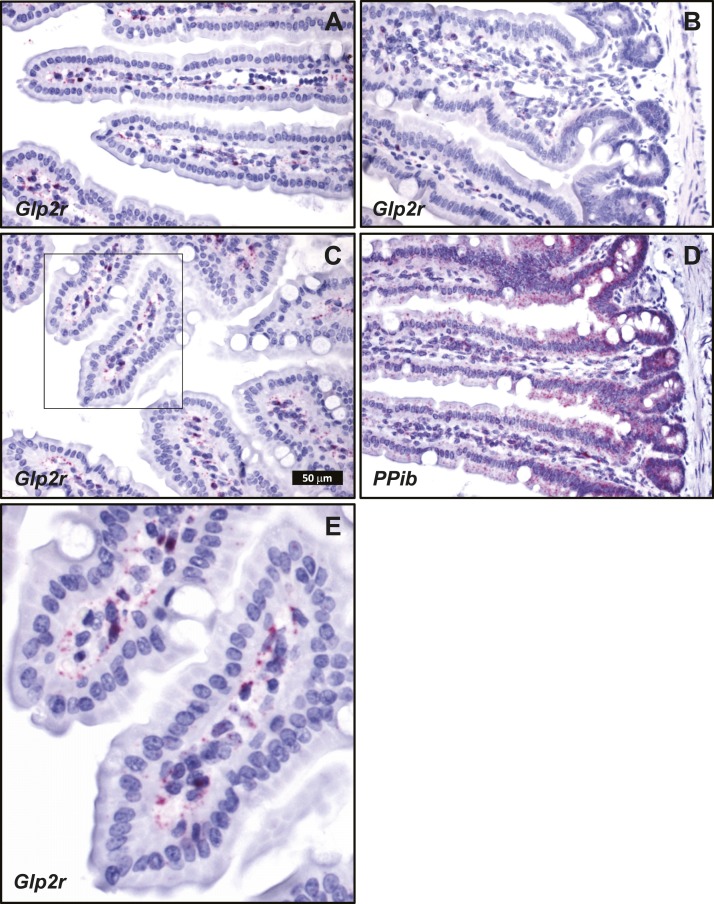
Figure 7.
Localization of (A–C and E) Glp2r- and (D) Ppib-positive control mRNA in mouse jejunum using RNAscope 2.5 ISH. (A–D) All images correspond to the same magnification. (E) A higher magnification of C, inset. Images are representative of five independent ISH trials using tissue sections from four Glp2r WT mice.

