
Figure 5. Functional connectivity common to all subregions.
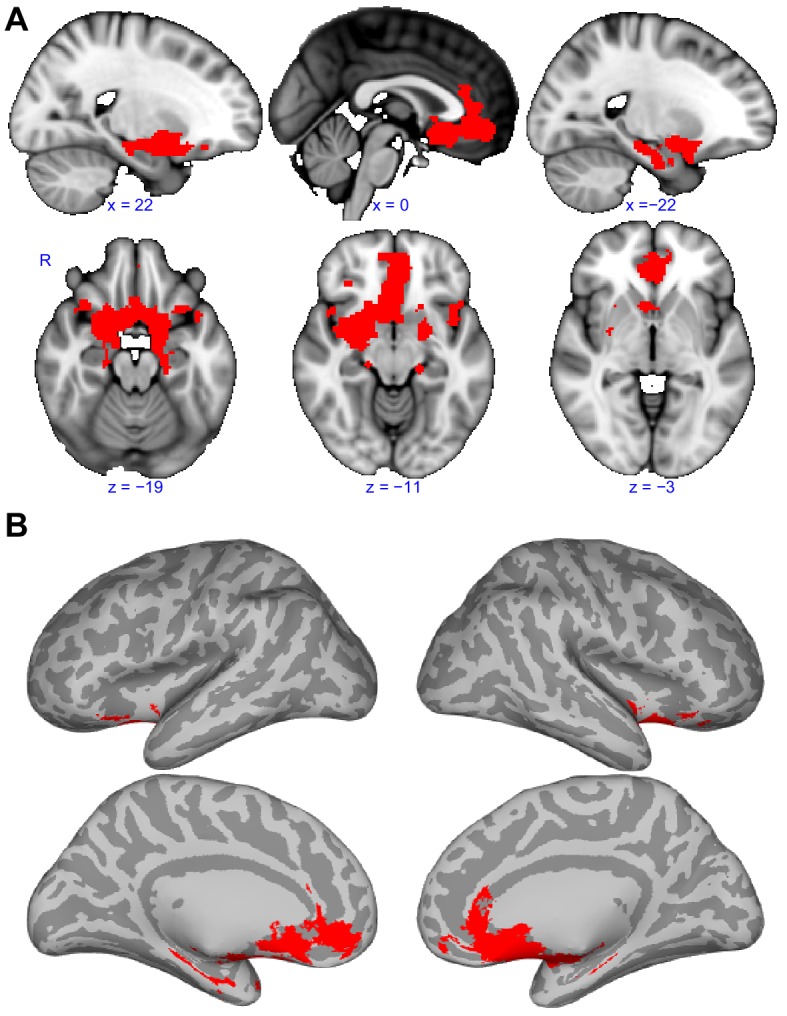
(A) Brain regions that showed statistically significant positive functional connectivity with each of the primary olfactory subregions. Results are overlaid on the FSL’s sagittal and axial MNI152_T1_1mm_brain. (B) Same brain regions as in (A) shown on medial (top row) and lateral (bottom row) Freesurfer's cvs_avg35_inMNI152 brain surfaces. Red indicates the functional connectivity maps that were thresholded at threshold-free cluster enhancement corrected p<0.001. R, right hemisphere.
Figure 5—source data 1. Relates to Figure 5.
Functional connectivity patterns common to all human primary olfactory cortex subregions.
elife-47177-fig5-data1.zip (15.6KB, zip)
DOI: 10.7554/eLife.47177.019