Figure 2.
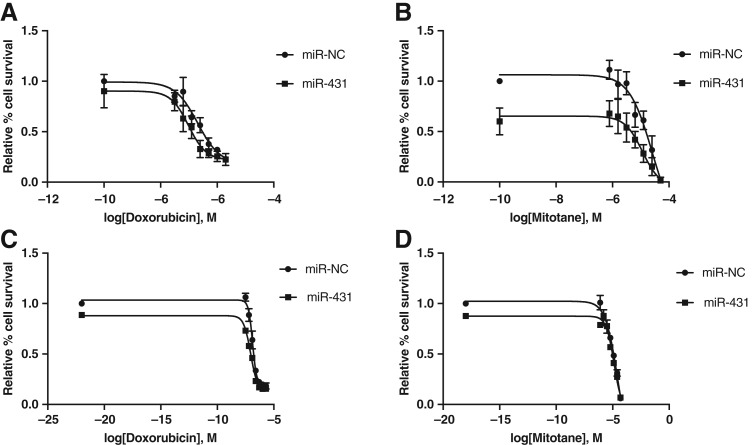
Dose response of H295R and primary adrenocortical carcinoma (ACC) cells following miR‐431 replacement and treatment with doxorubicin or mitotane, respectively. (A): H295R cells were restored with miR‐431/NC and treated with doxorubicin. A maximal left shift of the dose response curve was observed on Day 5, with a 53% decrease in half maximal inhibitory concentration (IC50; 205 to 97 nM doxorubicin). Error bars represent SEM, n = 3; p < .05 for miR‐431, NC effect, and doxorubicin dose effect. (B): H295R cells were restored with miR‐431/NC and treated with mitotane. A maximal left shift of the dose response curve was observed on Day 3, with a 55% decrease in IC50 (25.3 to 11.5 μM mitotane). Error bars represent SEM, n = 3; p < .05 for miR‐431, NC effect, and mitotane dose effect. (C): Primary ACC cells were restored with miR‐431/NC and treated with doxorubicin. A maximal left shift of the dose response curve was observed on Day 7, with a 32% decrease in IC50 (131 to 88 nM doxorubicin). Error bars represent SEM, n = 3; p < .05 for miR‐431, NC effect, and doxorubicin dose effect. p < .05 for miR‐431 + doxorubicin versus NC + doxorubicin. (D): Primary ACC cells were restored with miR‐431/NC and treated with mitotane. A maximal left shift of the dose response curve was observed on Day 7, with a 52% decrease in IC50 (27.5 to 13.2 μM mitotane). Error bars represent SEM, n = 3; p < .05 for miR‐431, NC effect, and mitotane dose effect. p < .05 for miR‐431 + mitotane versus NC + mitotane. miR‐NC, negative control.

