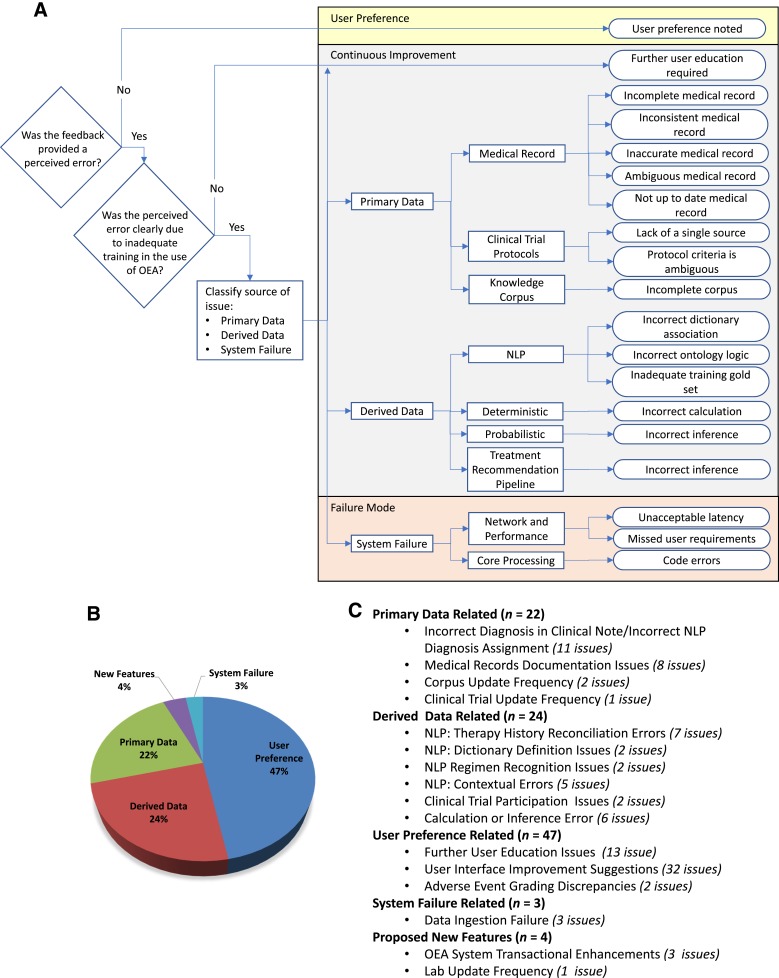
Figure 5.
Root cause analyses of issues identified during controlled introduction. (A): Flow chart of the process for logging errors identified during controlled introduction. (B): Pie chart of the 100 unique, reproducible errors logged during controlled introduction grouped into five root causes: primary data, derived data, user‐preference (primarily relating to user interface/user experience), system performance, and new function features. (C): Detailed summation of subcategories of root causes.
Abbreviations: NLP, Natural Language Processing; OEA, Oncology Expert Advisor.

