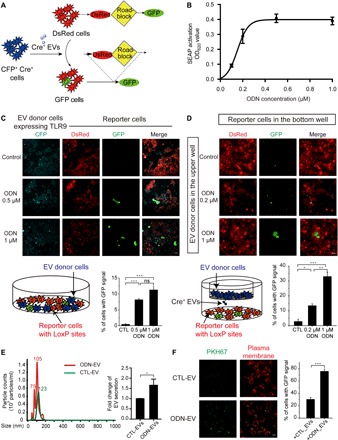
Fig. 2. ODN enhances EV transfer between cells expressing TLR9.

(A) Schematic diagram showing the Cre-LoxP reporter system used to visualize the transfer of Cre+ recombinase [cyan fluorescent protein (CFP), cyan] activity. A red-to-green color switch is induced in reporter+ cells (red) upon the transfer of Cre activity from CFP+ Cre+ cells. (B) Dose-dependent activation of TLR9 by ODN. HEK-Blue hTLR9 cells were treated by different concentrations of ODN (0.2, 0.4, 0.6, 0.8, and 1.0 μM) for 24 hours, and activation was determined by luminescence assay. SEAP, secreted embryonic alkaline phosphatase; OD620, optical density at 620 nm. (C) Images of HEK-293 cultures consisting of a mixture of TLR9-Cre+ (CFP+) and reporter+ (DsRed+) cells. Cells were treated with 0.5 or 1 μM ODN for 24 hours. Graph represents the percentage of reporter+ cells with green fluorescent protein (GFP) signals. Scale bars, 50 μm. ns, not significant. (D) Images of HEK-293 reporter+ cells at the bottom well of a Transwell system and TLR9-Cre+ (cyan) cells in the upper well with or without ODN treatment. TLR9-Cre+ cells were treated with 0.2 or 1 μM ODN for 24 hours and then subcultured in Transwell. Cells were washed twice by centrifugation before the subculture. Graph represents the percentage of reporter+ cells with GFP. Scale bars, 100 μm. (E) NTA displaying the size distribution of EVs isolated from RAW 264.7 cell cultures with (ODN-EV) or without (CTL-EV) the treatment of ODN. The images are representative of three independent experiments. Graph represents the fold change of the numbers between CTL-EV and ODN-EV. (F) Images of RAW 264.7 cells taking up CTL-EV or ODN-EV. CTL-EV and ODN-EV were stained with PKH67 (green), and the plasma membrane of recipient cells was labeled by anti-Glut1 (red). Graph represents the percentage of reporter+ cells or RAW 264.7 cells with green fluorescence signals. Scale bars, 20 μm. Graphs show means ± SEM. [*P < 0.05; **P < 0.01; ***P < 0.001; ns, not significant using analysis of variance (ANOVA) one-way test (C and D) or unpaired Student’s t test (E and F)]. Results are representative of at least three independent experiments.
