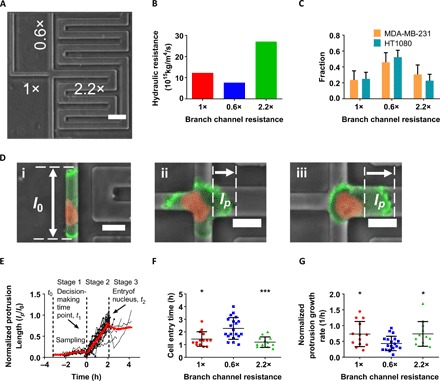
Fig. 1. Decision-making strategy and cell dynamics at trifurcating Ψ-like branch channels of different hydraulic resistances.

(A) Phase contrast image of a Ψ-like trifurcating microfluidic device. The relative hydraulic resistance of each branch channel is indicated. Scale bar, 50 μm. (B) Absolute values of the hydraulic resistance of each branch channel shown in (A). (C) Distribution pattern of MDA-MB-231 and HT1080 cells in branch channels of different hydraulic resistances (n > 70 from three independent experiments for each cell line). Data represent the mean with 95% confidence interval. (D) Evaluation of protrusion dynamics of LifeAct-GFP H2B-mCherry MDA-MB-231 cells at the trifurcation. (i) Representative cell in the feeder channel before reaching the intersection. l0 is defined as the overall cell front-rear length. (ii) Representative cell at the intersection. lp is defined as the protrusion length inside the branch. (iii) Representative cell entering the right branch channel after decision is made. lp is defined as the distance between the leading edge of the cell and the nucleus. Scale bars, 20 μm. The contrast of the fluorescent signals has been increased in all images uniformly for visualization purposes. (E) Normalized protrusion length (lp/l0) for cells choosing the straight branch channel (n = 14) over time. Red line represents the moving average. At t0, cells first reached the intersection; at t1, the decision was made; and at t2, the nucleus fully entered the branch channel at the trifurcation. (F) Cell entry time, t2 − t1, in branch channels of different hydraulic resistances (n > 10 cells for each branch from >3 independent experiments). Data represent the means ± SD; Kruskal-Wallis with post hoc Dunn was performed, *P < 0.05 and ***P < 0.001 relative to the cells choosing the straight branch. (G) Normalized leading protrusion growth rate for cells entering branch channels of different hydraulic resistances (n > 10 for each branch from >3 independent experiments). Data represent the means ± SD; one-way analysis of variance (ANOVA) with post hoc Tukey was performed, *P < 0.05 relative to the cells choosing the straight branch.
