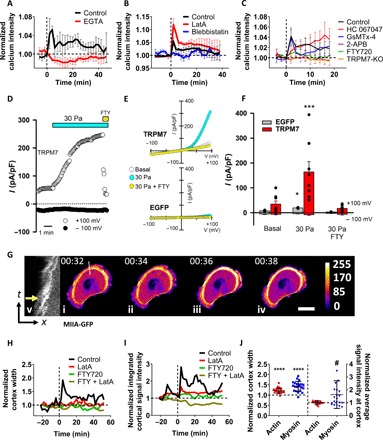
Fig. 3. Hydrostatic pressure induces intracellular calcium increase via TRPM7 activation.

(A to C) Normalized calcium signal intensity of vehicle control and drug-treated or TRPM7 knockout (KO) MDA-MB-231 cells on 2D following the application of a 3-Pa hydrostatic pressure differential at t = 0 min (n > 30 cells from three independent experiments). All signal intensities are normalized to those of the respective unstimulated controls. Data represent means ± SEM. (D) Time course of whole-cell TRPM7 cationic currents recorded at +100 and −100 mV in a HEK293 cell transfected with mouse TRPM7 and exposed to a 30-Pa increase in hydrostatic pressure followed by exposure to 10 μM FTY720. (E) Current-voltage relationships of whole-cell cationic currents in HEK293 cells expressing mouse TRPM7 (top) or enhanced green fluorescent protein (EGFP; bottom) under basal conditions and after the application of a 30-Pa hydrostatic pressure differential in the presence or absence of FTY720. (F) Mean current densities measured under the different experimental conditions shown in (E). TRPM7-expressing cells (n = 8) and EGFP-expressing cells (n = 3). *P < 0.05, ***P < 0.002 for 30 Pa versus any other condition by Kruskal-Wallis followed by Dunn’s post hoc test. (G) Representative image sequence depicting the MIIA-GFP signal of an MDA-MB-231 cell before and after the application of a 3-Pa hydrostatic pressure differential. Pressure is applied right after (ii). Scale bar, 20 μm. (v) Kymograph of the line scan shown in (i) to (iv). The yellow arrow indicates the first frame after the application of a hydrostatic pressure differential. In (i) to (iv), following image segmentation, each pixel’s intensity value was assigned a color according to ImageJ’s fire heat map for visualization purposes. (H) Normalized cortex width and (I) normalized integrated cortical signal intensity of MIIA-GFP–labeled MDA-MB-231 cells following the application of a 3-Pa hydrostatic pressure differential at t = 0 min in response to vehicle control (n > 20 cells from three independent experiments), LatA, and/or FTY720 treatments (n > 5 cells for each condition from two experiments). Data are normalized to the initial (treated or untreated) values at t = −22 min before the application of hydrostatic pressure. (J) Normalized width and average fluorescence intensity of cortical actin and myosin measured by LifeAct-Ruby2– and MIIA-GFP–labeled MDA-MB-231 cells, respectively, immediately after the application of a 3-Pa hydrostatic pressure differential (n > 20 cells from three independent experiments). Data are normalized to the values right before the hydrostatic pressure exposure. Mann-Whitney U test was performed, ****P < 0.0001 relative to width of actin or myosin cortex before hydrostatic pressure exposure and #P < 0.05 relative to signal intensity of cortical myosin before the application of hydrostatic pressure.
