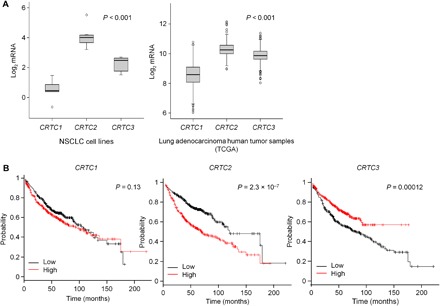
Fig. 1. CRTC expression in NSCLC.

(A) Expression of CRTC1, CRTC2, and CRTC3 mRNA in a panel of NSCLC cell lines (n = 8) and a collection of lung adenocarcinoma patient samples (n = 517) from the TCGA. Statistical test: Analysis of variance (ANOVA) with Tukey’s method for multiple comparisons. (B) Association of CRTC1, CRTC2, and CRTC3 mRNA levels with overall survival (OS) within lung adenocarcinoma datasets from the KM plotter (n = 720). Statistical test: Log-rank test.
