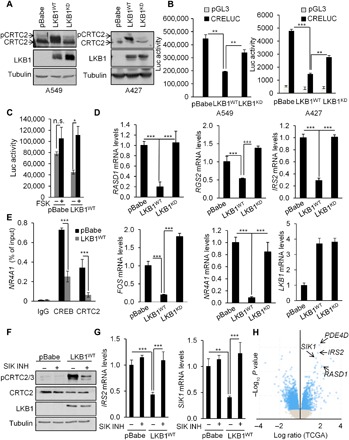
Fig. 2. LKB1 regulates CRTC2 activity and CREB signaling in NSCLC.

(A) Immunoblot analysis in A549 and A427 NSCLC cells expressing the pBabe vector, full-length LKB1 (LKB1WT), or kinase-dead LKB1 (LKB1KD) showing the effect of LKB1 expression on CRTC2 dephosphorylation and associated mobility shift. (B) Luciferase activity in A549 and A427 NSCLC cells expressing the pBabe vector, full-length LKB1, or kinase-dead LKB1 and transfected with a CRE-luciferace (CRE-luc) reporter. All values are expressed as means ± SD. **P < 0.01, and ***P < 0.001 determined by ANOVA with Tukey’s method. (C) Luciferase activity in A549 cells expressing the pBabe vector or full-length LKB1 and transfected with a CRE-luc reporter and treated with FSK (10 μM) for 4 hours. All values are expressed as means ± SD. *P < 0.05 determined by ANOVA with Tukey’s method. n.s., not significant. (D) RASD1, RGS2, IRS2, FOS, NR4A1, and LKB1 mRNA levels in A549 cells expressing the pBabe vector, full-length LKB1, or kinase-dead LKB1. All values are expressed as means ± SD. ***P < 0.001 determined by ANOVA with Tukey’s method. (E) Chromatin immunoprecipitation (ChIP) assay in A549 cells expressing the pBabe vector or full-length LKB1 showing the amounts of CREB and CRTC2 recruited to the NR4A1 promoter. All values are expressed as means ± SD. ***P < 0.001 determined by ANOVA with Tukey’s method. IgG, immunoglobulin G. (F) Immunoblot analysis in A549 cells expressing the pBabe vector or full-length LKB1 and treated with vehicle dimethyl sulfoxide (DMSO) or the selective SIK inhibitor YKL-05-096 (1 μM) for 3 hours showing the effect of the SIK inhibitor on CRTC2 phosphorylation at S274. (G) IRS2 and SIK1 mRNA levels in A549 cells expressing the pBabe vector or full-length LKB1 and treated with the SIK inhibitor YKL-05-096 (1 μM) for 3 hours. All values are expressed as means ± SD. **P < 0.01 and ***P < 0.001 determined by ANOVA with Tukey’s method. (H) Volcano plot that shows mRNA enrichment in LKB1-mutant (n = 40) versus LKB1 wild-type (n = 190) lung adenocarcinoma specimens obtained from the TCGA.
