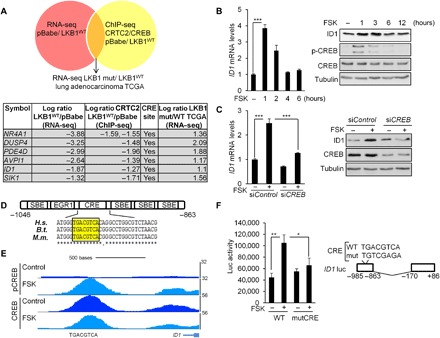
Fig. 4. ID1 is a direct CREB target.

(A) Schematic representation of the strategy followed to find CRTC2/CREB transcriptional targets in LKB1-deficient NSCLC. A table describing the six genes identified is also shown. (B) Immunoblot and quantitative reverse transcription polymerase chain reaction (qRT-PCR) analyses in 293T cells treated with vehicle (DMSO) or FSK (10 μM). All values are expressed as means ± SD. ***P < 0.001 determined by two-sided Student’s t test. (C) Immunoblot and qRT-PCR analyses in 293T cells depleted of CREB by small interfering RNA (siRNA) transfection (20 nM) for 72 hours and treated with FSK for 1 hour before collection of cell lysates. All values are expressed as means ± SD. ***P < 0.001 determined by ANOVA with Tukey’s method. (D) Schematic representation of the ID1 promoter. The Smad binding elements (SBEs), EGR1, and CREB-binding site (CRE) are indicated relative to the transcription start site. ClustalW sequence alignment for three animal species [Homo sapiens (H.s.), Bos taurus (B.t.), and Mus musculus (M.m.)] shows the conservation of the CRE site. (E) Representative pCREB and CREB ChiP-seq profiles at the ID1 loci in 293T cells treated with FSK (10 μM) for 1 hour. (F) Luciferase activity in 293T cells transfected with the (−985/−863) wild-type or (−985/−863) mutCRE ID1 luciferase reporter constructs and treated with FSK (10 μM) for 4 hours. All values are expressed as means ± SD. *P < 0.05 and **P < 0.01 determined by ANOVA with Tukey’s method.
