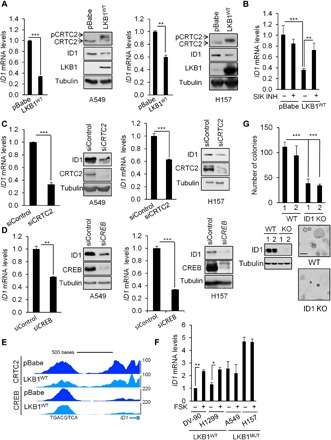
Fig. 5. The LKB1/CRTC2/CREB axis regulates ID1 expression in NSCLC cells.

(A) Immunoblot and qRT-PCR analyses in A549 and H157 NSCLC cells expressing the pBabe vector or full-length LKB1 (LKB1WT). All values are expressed as means ± SD. **P < 0.01 and ***P < 0.001 determined by two-sided Student’s t test. Immunoblot shows the effect of LKB1 on ID1 expression, CRTC2 dephosphorylation, and associated mobility shift. (B) ID1 mRNA levels in A549 cells expressing the pBabe vector or full-length LKB1 and treated with the SIK inhibitor YKL-05-096 (1 μM) for 3 hours. All values are expressed as means ± SD. **P < 0.01 and ***P < 0.001 determined by ANOVA with Tukey’s method. (C) Immunoblot and qRT-PCR analyses in A549 and H157 NSCLC cells transfected with siRNA targeting CRTC2 (20 nM) for 72 hours. All values are expressed as means ± SD. ***P < 0.001 determined by two-sided Student’s t test. (D) Immunoblot and qRT-PCR analyses in A549 and H157 NSCLC cells transfected with siRNA targeting CREB (20 nM) for 72 hours. All values are expressed as means ± SD. **P < 0.01 and ***P < 0.001 determined by two-sided Student’s t test. (E) Representative CRTC2 and CREB ChiP-seq profiles in A549 NSCLC cells expressing the pBabe vector or full-length LKB1 at ID1 loci. (F) ID1 mRNA expression in a panel of LKB1 wild-type or LKB1-mutant (MUT) NSCLC cell lines treated with FSK (10 μM) for 1 hour. All values are expressed as means ± SD. *P < 0.05 and **P < 0.01 determined by two-sided Student’s t test. (G) Anchorage-independent growth assessed by soft agar assay in A549 clones deleted for ID1 by CRISPR-Cas9. Representative images are shown. Lysates were immunoblotted with the indicated antibodies. Scale bar, 100 μm. All values are expressed as means ± SD. ***P < 0.001 determined by two-sided Student’s t test.
