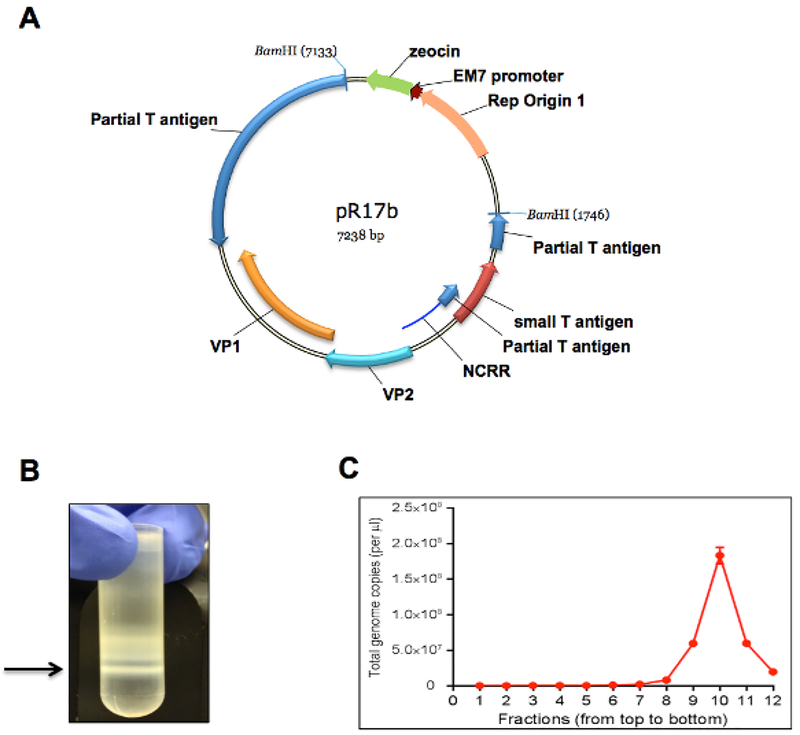
Figure 2. Production of MCPyV virion using recombinant viral genome.
(A) A plasmid map of pR17b (MCPyV genome plasmid). (B) A representative picture of an MCPyV virion sample harvested and purified over a gradient. Arrow marks the band of MCPyV virions concentrated in the core of the gradient. (C) The viral genome copy number in each gradient fraction was quantified using qPCR. Core gradient fractions (numbers, counting from the top of the gradient, are indicated at the bottom of the graph). Error bars represent standard error of the mean (S.E.M.) of three technical repeats. Please click here to view a larger version of this figure.

