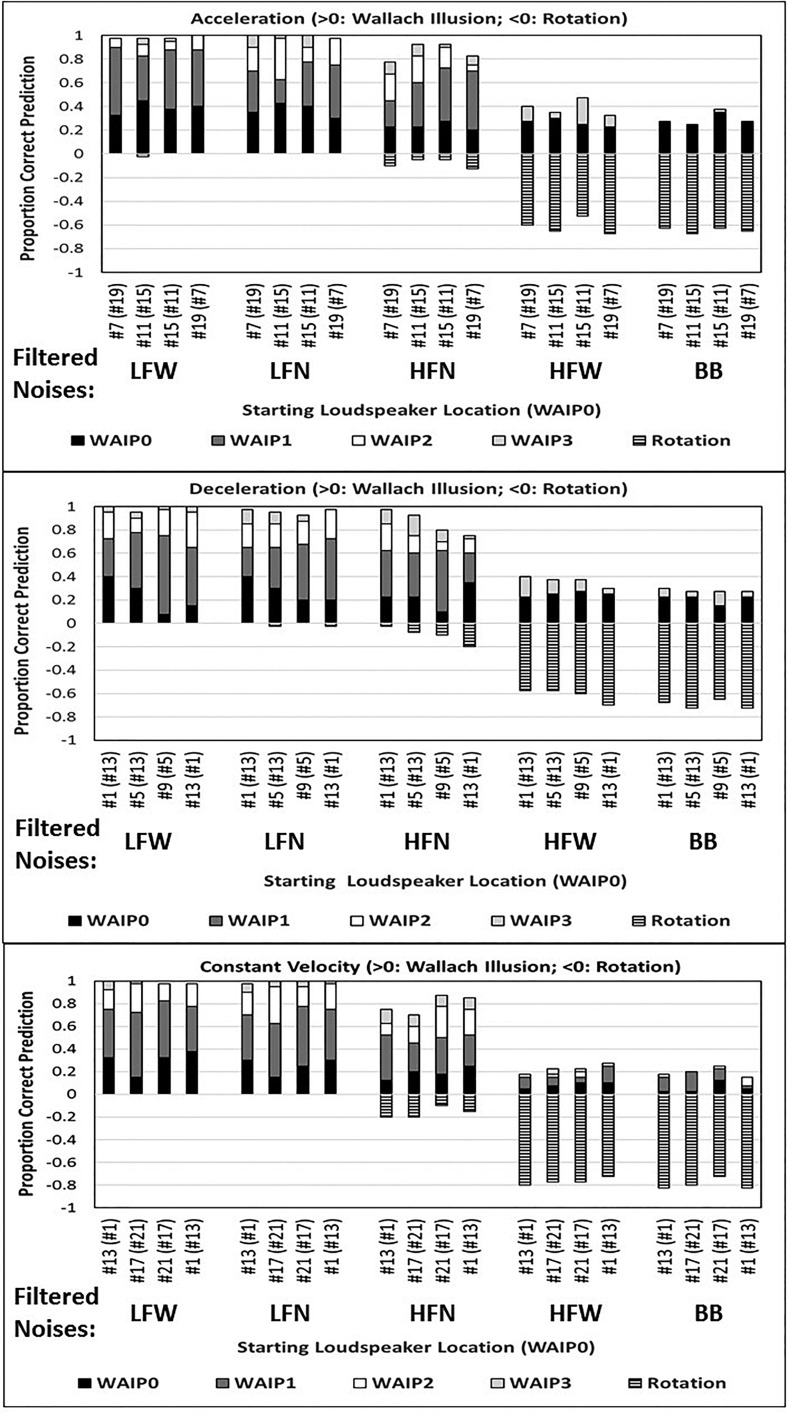
FIG. 3.
The three panels represent data from the three rotation stages (A) acceleration, (B) deceleration, (C) constant angular velocity. Mean data (eight listeners) indicate proportion of correct predictions as a function of the five types of filtered noise (LFW, LFN, HFN, HFW, BB) and the four starting loudspeaker locations of the noise burst (WAIP0 loudspeaker location is indicated in parenthesis; see Table I). Positive proportions (0–1.0) represent the proportion of WAI responses. The black, bottom portion of each positive histogram bar represents the proportion of responses indicating the exact loudspeaker location predicted by the WAI (WAIP0). The other portions of the positive-going histogram bars represent the proportion of responses for the WAIP1, WAIP2, and WAIP3 loudspeaker locations. The negative going horizontally hashed bars represent the proportion of responses (0 to −1.0) of clockwise rotation. See the text for additional details.

