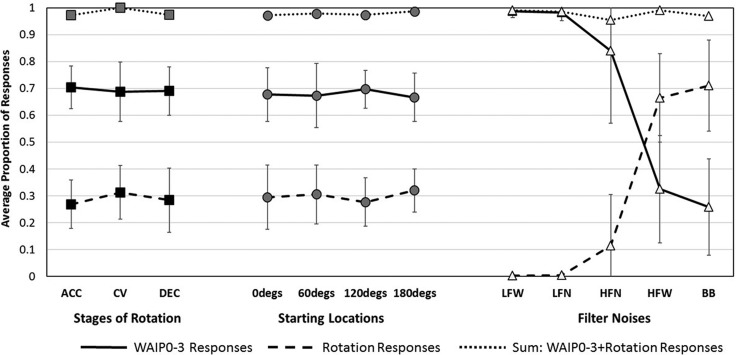
FIG. 4.
The average proportion of responses (eight listeners) are shown for WAIP0-3 responses (middle figures with solid lines), rotation responses (bottom figures with dashed lines), and the sum of the WAIP0-3 and rotation responses (top figures with dotted lines). Data showing average responses over the three stages of rotation (squares), the four starting locations of the noise bursts (circles), and the five filtered noises (triangles) are shown. Error bars are ±1 standard deviation (error bars for data near 0.0 or 1.0 are smaller than the symbols). See the text for details about the averaging.

