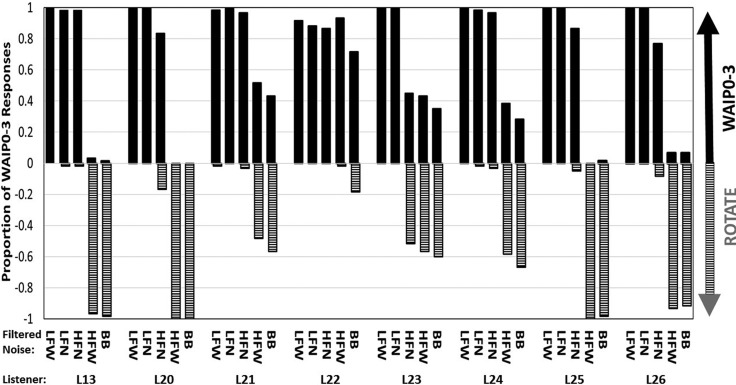
FIG. 6.
Display is similar to Fig. 3, showing proportion of WAIP0-3 responses averaged over the four starting loudspeaker locations and the three stages of rotation for each of the five filtered noise conditions (LFW, LFN, HFN, HFW, and BB) for each of the eight listeners (L13 and L20–L26). Positive-going. black histogram bars represent WAIP0-3 responses, while horizontally hashed, negative-going bars represent the proportion of clockwise rotating (rotate) responses (see Fig. 4).

