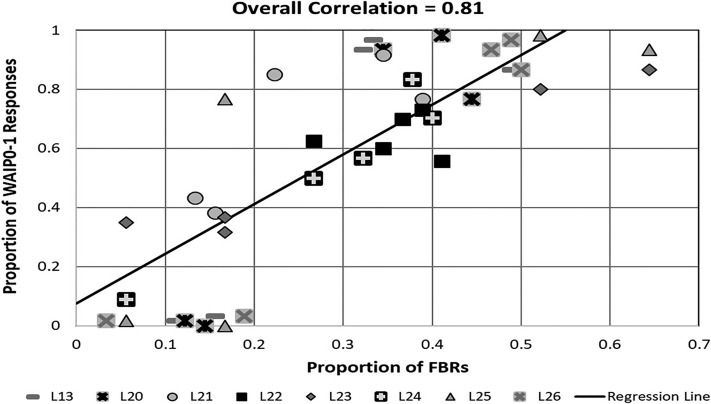
FIG. 7.
Scatter diagram showing the average proportion of WAIP0-1 responses (see Fig. 3) as a function of the average proportion of FBRs (see Fig. 1) for each of the eight listeners (L13 and L20–L26; different symbols). Data include the five filtered noise conditions, but are averaged over starting loudspeaker locations and stages of rotation. See the text for the criterion used to define proportions. Straight line indicates the linear regression fit, and the Pearson product moment-correlation is 0.8.

