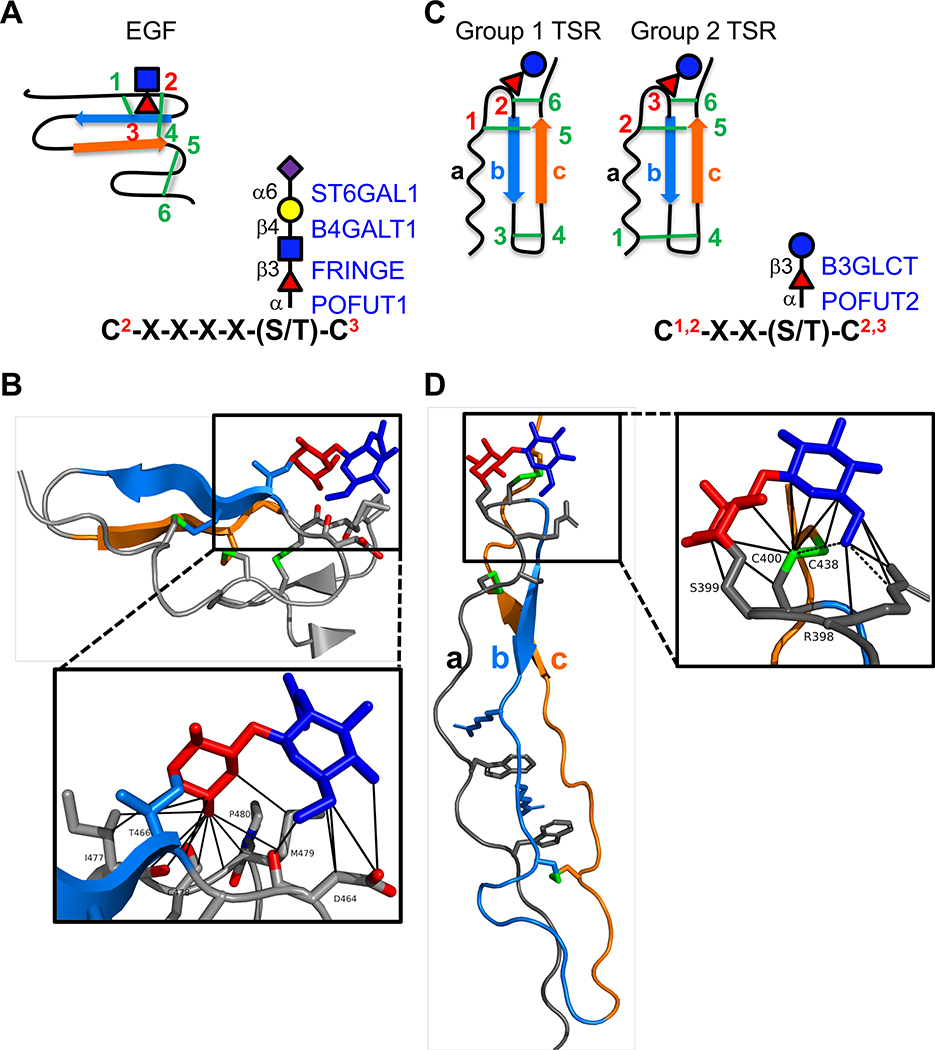
Figure 1. EGF repeats and TSRs are modified by O-fucose glycans A.
(left) Cartoon showing disulfide bonding pattern (green lines) in an EGF repeat. Beta strands are indicated by blue and orange arrows. Site of O-fucosylation and GlcNAc elongation are indicated by red triangle and blue square, respectively. (right) Consensus sequence for POFUT1 modification. C2 and C3 are the second and third conserved cysteine in the EGF repeat. Enzymes responsible for addition of each sugar are indicated in blue on the right with linkages in black on the left. Fucose, red triangle; GlcNAc, blue square; Galactose, yellow circle; Sialic Acid, purple diamond. B. Structure of NOTCH1 EGF12 modified with a GlcNAcβ1–3Fucose disaccharide (from PDB ID 4D0E). Beta strands colored as in A. Fucose in red, GlcNAc in blue, disulfide bonds in green, oxygen atoms highlighted in red. Box shows zoomed in region highlighting interactions of the disaccharide with underlying amino acids identified by MolProbity [73,74] (van der Waals, solid lines). Structures rendered in PyMOL (Version 2.2.2). C. (left) Cartoons showing the two distinct disulfide bonding patterns for TSRs. Beta strands are indicated by blue and orange arrows. Position of O-fucosylation and elongation with glucose are indicated by red triangle and blue circle, respectively. (right) Consensus sequence for POFUT2 modification. The C’s can be C1 and C2 or C2 and C3 depending on whether the TSR is Group 1 or Group 2. Enzymes responsible for addition of each sugar are indicated in blue on the right with linkages in black on the left. Fucose, red triangle; Glucose, blue circle. D. Structure of ADAMTS13 TSR1 modified with Glucoseβ1–3-Fucose disaccharide (from PDB ID 3GHM). The three strands (a, b, and c) of the TSRs are color coded the same in the cartoons (C) and the structure. Fucose in red, glucose in blue, disulfide bonds in green. Box shows zoomed in region highlighting interactions of the disaccharide with underlying amino acids identified by MolProbity [73,74] (H-bonds, dashed lines; van der Waals, solid lines). Structures rendered in PyMOL (Version 2.2.2).

