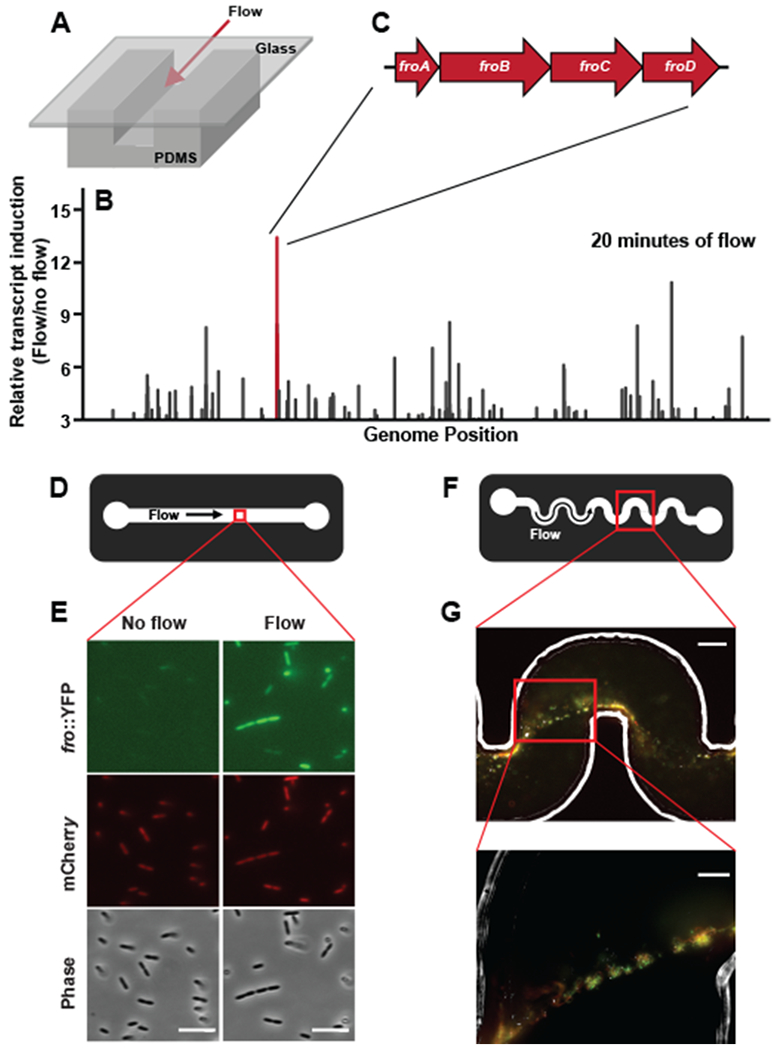
Fig. 1: Flow triggers induction of gene expression in Pseudomonas aeruginosa.

(A) Schematic of microfluidic devices used throughout this study. Channels are custom-fabricated of polydimethylsiloxane (PDMS) and glass. (B) The fold-change in transcript abundance of P. aeruginosa cells subjected to flow for 20 minutes relative to flow-naïve cells. Line length linearly corresponds to fold-change and is plotted as a function of genomic location on the P. aeruginosa chromosome. Only genes induced at least 3-fold are represented, and the raw data used to generate this graph is presented in Supplementary Table 2. The red line corresponds to the fro operon. (D) Schematic depicting the view from above the microchannel used in E. These channels are 50 μm tall by 500 μm wide. (E) Fluorescence and phase images of fro reporter strain in straight microfluidic channels before and after 4 hours of 10 μl/min flow. Images are representative of three independent experiments. Scale bars indicate 5 μm. (F) Schematic of the microchannel used in G. These channels are 90 μm tall by 100 μm wide. (G) A merged image of Phase, YFP, and mCherry from a single optical plane of a representative streamer biofilm projecting off the wall of a microchannel. Images are representative of three independent experiments. Streamers were cultured in 2 μl/min flow for 20 hours. Lower picture is zoomed in on cells that are not directly in contact with the channel surface. Scale bar of top image indicates 50 μm and scale bar of bottom image indicates 20 μm.
