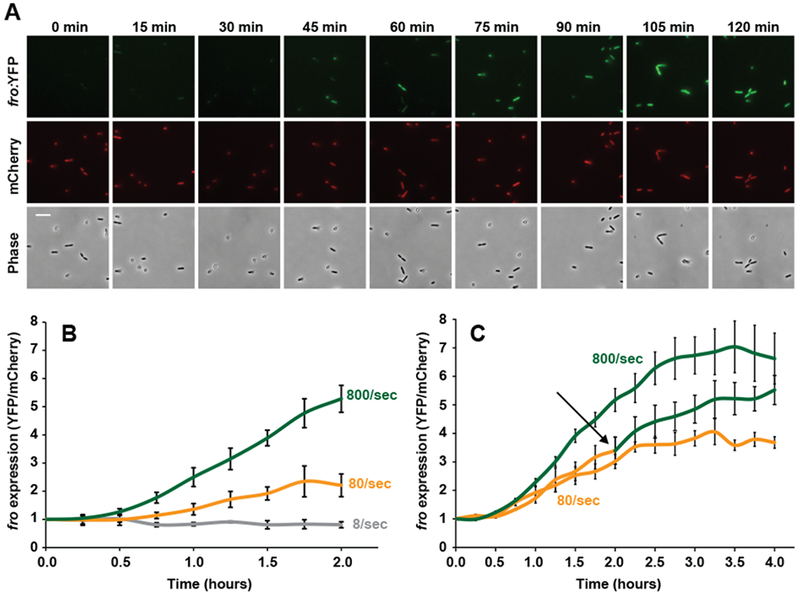
Fig. 2: Shear rate rapidly and dynamically tunes rheosensing.

(A) Images of cells exposed to flow at a wall shear rate of 800 sec−1 over 120 min. Top images show the fro reporter (YFP) channel, middle images show the mCherry normalization control channel, and bottom images show the phase contrast channel. Images are representative of three independent experiments. Scale bar indicates 5 μm. (B) fro expression over 2 hours of time in the presence of 8 (gray line), 80 (yellow line), and 800 sec−1 (green line) shear rates. At 2 hours, 8/sec and 80/sec samples are statistically different from each other with P=0.03, calculated by a 2-sided T-test. At 2 hours, 80/sec and 800/sec samples are statistically different from each other with P=0.008, calculated by a 2-sided T-test. (C) fro expression over 4 hours of time in the presence of 80 sec−1 (yellow line), 800 sec−1 (green line), or an upshift from 80 sec−1 to 800 sec−1 (yellow-green line). The black arrow depicts the 2-hour time point where shear rate was increased from 80 sec−1 to 800 sec−1 for the upshifted sample. At 4 hours, the upshifted sample results in fro expression that is statistically different from the 80 sec−1 sample with P=0.03, calculated by a 2-sided T-test. Error bars show SEM of three independent replicates. Each replicate represents quantification from 50 cells, fro expression at time 0 set is set to 1. Channels used for these experiments were 50 μm tall by 500 μm wide.
