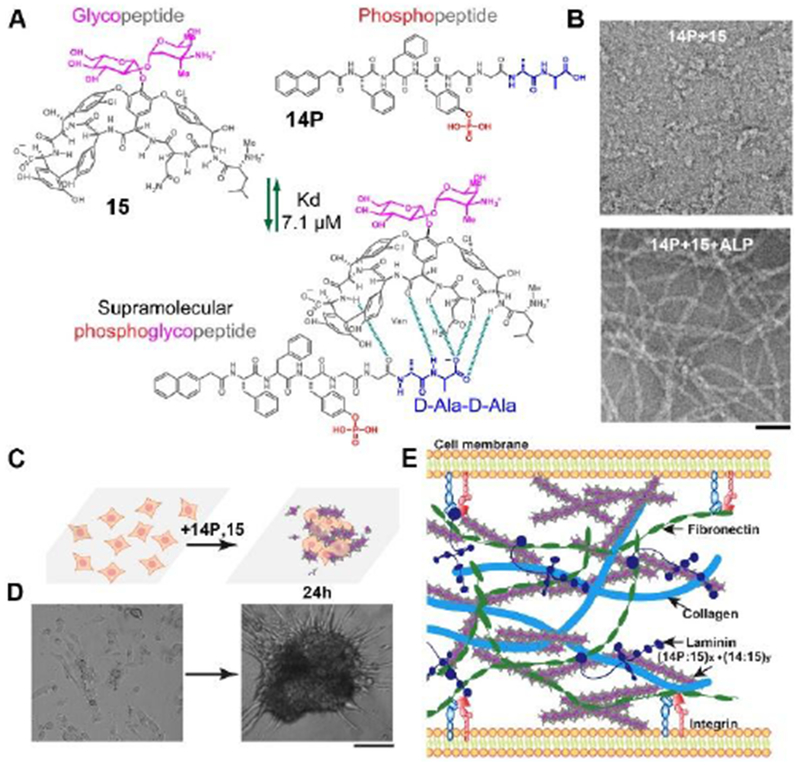
Figure 9.

(A) Ligand–receptor interactions (green dash lines, dissociation constant (Kd) is 7.1 μm)) between vancomycin (Van, 15) and the D-Ala-D-Ala containing phosphopeptides (Nap-FFpYGGaa, 14P) result in a sPGP (14P:15). (B) Transmission electron microscopic (TEM) images of 14P:15 (300 μM) before and after being treated by a phosphatase (ALP, 1 UmL−1. 24 h). Scale bar is 50 nm. (C) The illustration of forming 3D spheroids from a 2D cell sheet upon the addition of sPGP and the reversibility of the process. (D) Optical images of time-dependent formation of 3D cell spheroids. Scale bar is 50 μm. (E) Illustration of sPGP assemblies as an ECM mimic to interact with major ECM components. Adapted with permission from ref. 9. Copyright 2017, Wiley-VCH.
