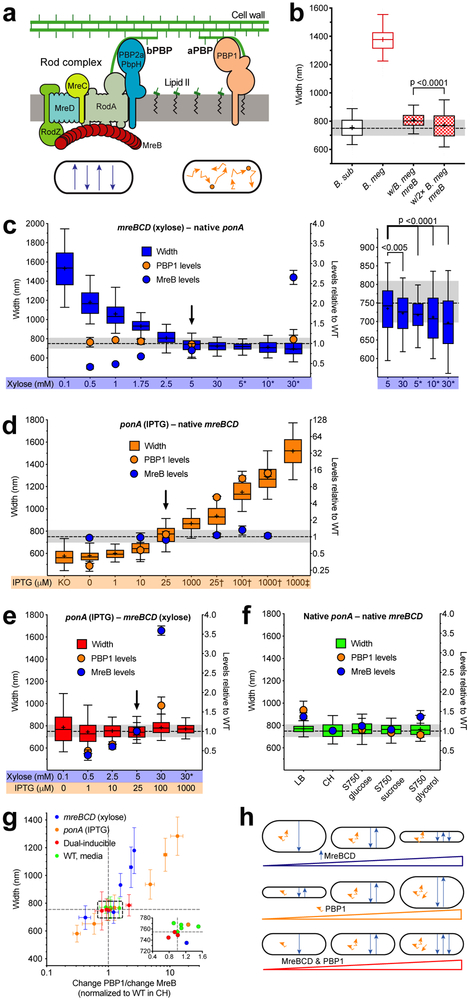
Figure 1 — Rod width depends on the relative levels of widening aPBPs to the thinning Rod system.
Except where indicated, all strains were grown in CH medium. For b–f, the median width of WT B. subtilis grown in CH is depicted by dashed line, grey shading indicates 25–75 percentiles. For details regarding statistics and box plot definitions, see the “Statistics” subheading in “Methods”.
a. Diagram depicting the two peptidoglycan synthesis systems responsible for elongation. Bottom - schematic of each system’s in vivo motions.
b. B. subtilis expressing B. megaterium mreB forms rods close to B. subtilis width. “B. sub” is WT B. subtilis. “B. meg” is B. megaterium. Checkered boxes are bMD465 (amyE::erm Pxyl-mreBCD minCDB. megaterium, ΔmreBCD ΔminCD::spc mreBCD minCDB. megaterium), a B. subtilis strain where the native mreBCD minCD operon was replaced with the same operon from B. megaterium, and an additional B. megaterium mreBCD minCD operon under xylose control at an ectopic locus. “w/B. meg mreB” was grown with 1% glucose to repress ectopic expression. “w/2× B. meg mreB” was grown with 30 mM xylose to overexpress the ectopic B. megaterium mreB operon.
c–f. Titrations of ponA and mreBCD vs. cell width. Strains were grown with the inducer concentrations below each graph. Width plotted on left, mean MreB and PBP1 relative abundances (determined by mass spectrometry, normalized to levels in WT cells grown in CH) on right. Arrowheads are inductions producing WT widths and protein levels. Supplementary Figure 3c shows effects on cell length.
c. Diameter decreases with mreBCD induction.
Inductions of bMD545 (amyE::erm Pxyl-mreBCD, ΔmreBCD::spc), except for those marked * which are bMK355 (amyE::erm Pxyl-mreBCD) containing a xylose-inducible mreBCD in addition to native mreBCD. Right is a zoomed view of highest 5 inductions. Supplementary Figure 1c–d shows MreB levels determined by western blot across the entire range.
d. Cell diameter increases with ponA induction. “KO” is bMK005 (ΔponA::cat). Inductions of bMD598 (yhdG::cat Pspank-ponA, ΔponA::kan), except for the those marked † and ‡, which are under stronger promoters; † is bMD586 (yhdG::cat Phyperspank-ponA, ΔponA::kan), ‡ is bMD554 (yhdG::cat Phyperspank-ponA) which has an inducible ponA in addition to the native copy.
e. Balanced expression of both PG synthetic systems yields normal width across a large range.
Dual inductions of bMD620 (amyE::erm Pxyl-mreBCD, ΔmreBCD::spc, yhdH::cat Pspank-ponA, ΔponA::kan). * indicates bMD622 (amyE::erm Pxyl-mreBCD, yhdG::cat Pspank-ponA, ΔponA::kan) with a xylose-inducible mreBCD in addition to native mreBCD.
f. WT B. subtilis maintains constant width in different media.
g. WT width is maintained within a narrow range of relative PBP1/MreB ratios. Plotted are mean widths (error bars are SD) of cells from c–f against the ratio of fold change in PBP1 to MreB. Inset shows zoomed view of box. Lines indicate mean WT width and PBP1/MreB ratio.
h. Model for how the two PG synthesis systems affect rod width. Top – As circumferentially organized PG synthesis increases (blue arrows), cell diameter decreases. Middle – As non-circumferential synthesis increases (orange squiggles), so does cell diameter. Bottom – As long as non-circumferential and circumferential synthesis is balanced, width remains constant, even across a range of protein levels.

