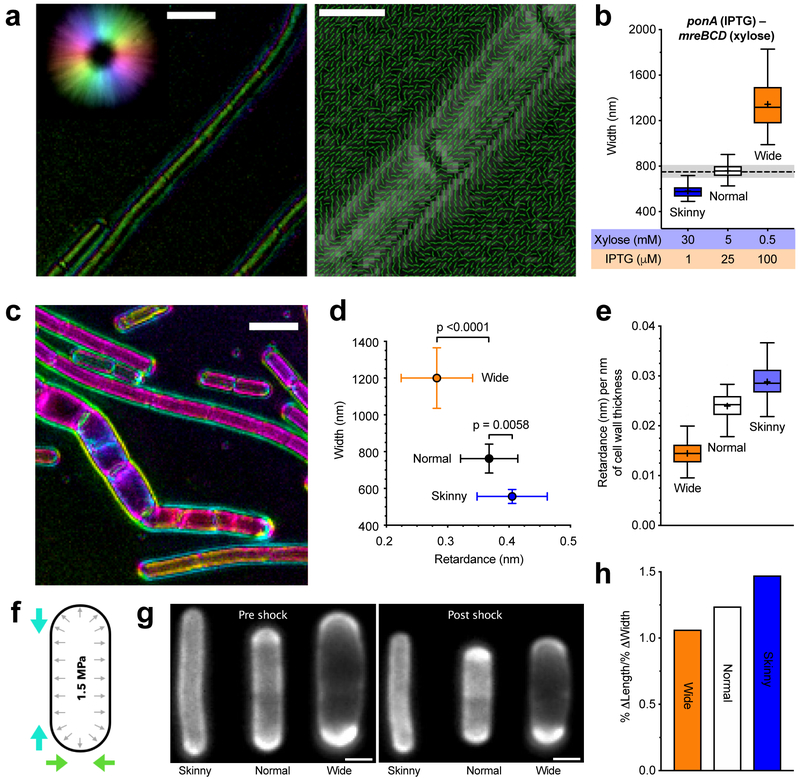
Figure 4 — Increased Rod activity increases both the amount of oriented material within sacculi and their mechanical anisotropy.
For details regarding statistics and box plot definitions, see the “Statistics” subheading in “Methods”.
a. Polarization microscopy reveals oriented material within the cell wall. Retardance is the differential optical path length for light polarized parallel and perpendicular to the axis of molecular alignment; alternatively, it is defined as birefringence (Δn) multiplied by the path length through an anisotropic material. Left – Example LC-PolScope image of purified WT sacculi. Focused at the surface, the wall is seen to be birefringent. Color is the slow axis orientation, intensity corresponds to retardance in that direction (reference, upper left circle). Scale bar is 2 μm. Right - Polarization orientation view of sacculi surface; lines point in predominant orientation of the slow axis. Scale bar is 1 μm. See also Supplementary Movie 2.
b. Inductions used to assay sacculi. bMD620 (amyE::erm Pxyl-mreBCD, ΔmreBCD::spc, yhdG::cat Pspank-ponA, ΔponA::kan) was induced to grow at 3 different widths. Dashed line is the median width of WT B. subtilis, shading indicates 25-75 percentiles.
c. Example LC-PolScope image of bMD620 sacculi induced at different widths. Pairs of purified sacculi (wide and normal, or wide and skinny) were combined and Z-stacks collected in 100 nm steps. Scale bar is 2 μm. See also Supplementary Movie 3.
d–e. The amount of oriented material in the cell wall increases with mreBCD induction, and inversely correlates with width.
d. Mean retardance vs. width of projected Z-stacks of at least 90 different cells for each condition (error bars are SD).
e. Mean retardance normalized to the mean thickness of cell walls in each induction condition (determined with TEM; Supplementary Figure 6a).
f. Schematic of osmotic shock assay of anisotropy. B. subtilis sacculi are normally stretched by high internal turgor (black arrows). Hyperosmotic shocks negate this pressure, allowing observation of how sacculi shrink in length and width (colored arrows).
g. Example FDAA-labeled cells before and after shocks. Scale bars are 1μm.
h. As the relative amount of Rod activity increases, so does the mechanical anisotropy of the sacculus. Percent change in length/percent change in width for each condition following osmotic shock. See also Supplementary Figure 6b–d.

