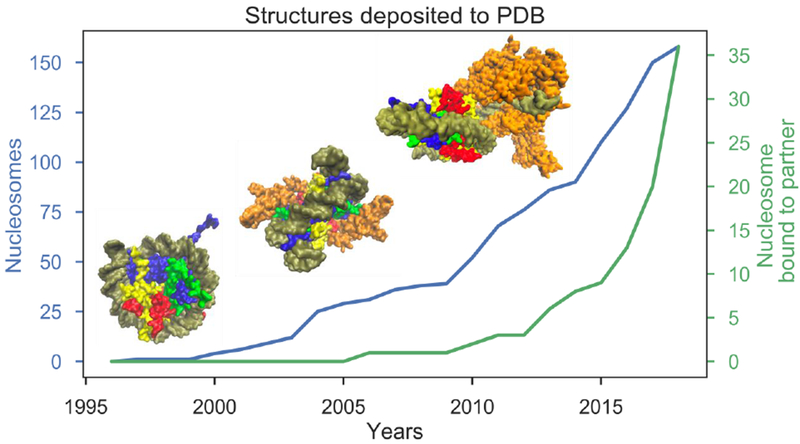
Figure 1. Growth trends in the number of nucleosome structures.

Blue graph shows the cumulative number of NCP structures in the PDB while the green graph shows the structures of the NCP in complex with a protein or peptide. From left to right, insets illustrate the first nucleosome crystal structure (1AOI, [1]), Sir3 BAH domain bound to yeast nucleosome (3TU4, [64]) and RNA Polymerase II elongation complex stalled at nucleosomal DNA SHL-2 (6A5R, [65]).
