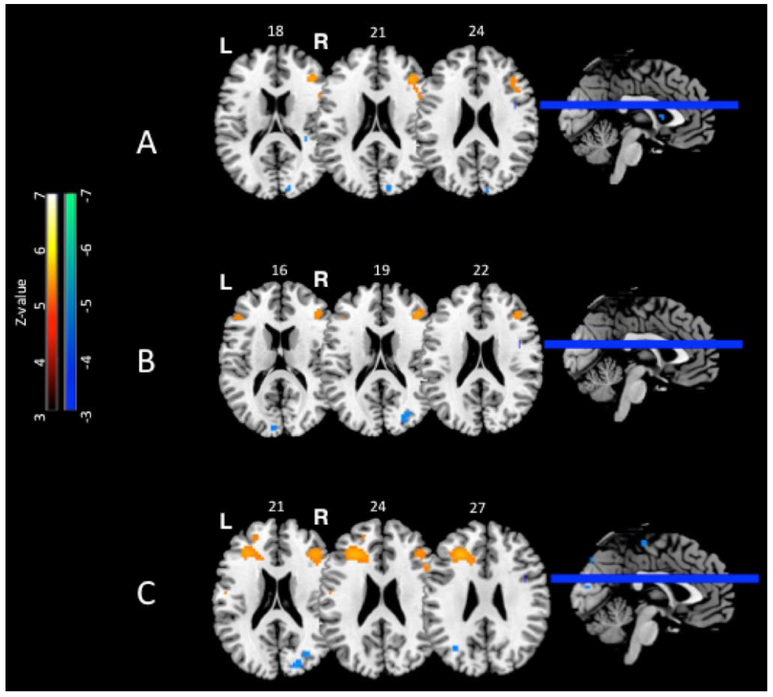
Fig. 2.
Cross sectional between-group differences. The number above each slice indicates the MNI z coordinate. Warm colors indicate increased activation while cool colors indicate decreased activation for the breast cancer versus healthy control group, revealing an overall pattern of decreased posterior activations that may necessitate compensatory increased activation in anterior brain regions for the breast cancer group. A. Encoding activation at baseline for the All (deep+shallow) contrast. Baseline, before chemotherapy, the breast cancer group showed greater activation than healthy controls in right prefrontal regions corresponding to BA 45/46 of lateral prefrontal cortex. B. Encoding activation at Time 2 for the All (deep+shallow) contrast Time 2, after chemotherapy, the breast cancer group showed greater activation than healthy controls in right prefrontal regions corresponding to BA 6 of premotor cortex and BA 45 of ventrolateral prefrontal cortex. C. Retrieval activation at Time 2 for All (deep+shallow) contrast. Time 2, after chemotherapy, the breast cancer group showed greater activation than healthy controls in bilateral middle frontal gyrus (BA 45/46). T-maps rendered on Montreal Neurologic Institute MRI Atlas using MRIcron (Rorden & Brett 2000) at voxel-wise p-values less than 0.001

