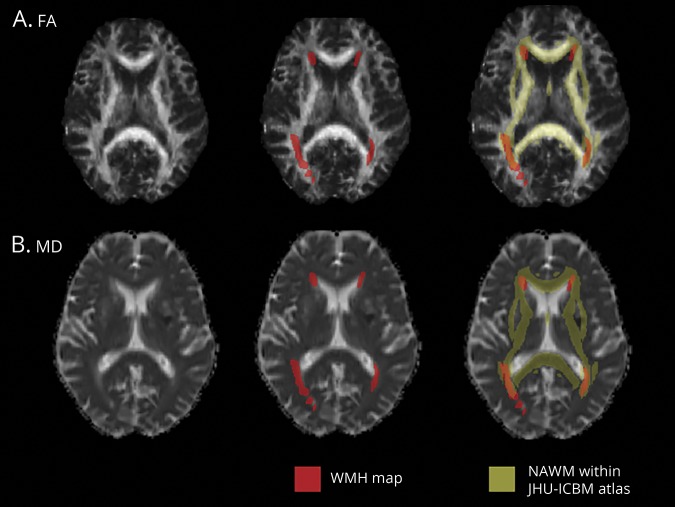
Figure 1. Diffusion tensor imaging (DTI) measurements in normal-appearing white matter (NAWM).
Examples of (A) fractional anisotropy (FA) and (B) mean diffusivity (MD) maps registered in Montreal Neurological Institute space from a single participant. Average FA and MD value within (NAWM) was calculated from the regions shown in yellow, that is, within a mask including all the main white matter tracts from the JHU-ICBM DTI atlas and excluding regions of white matter hyperintensity (WMH) obtained with brain intensity abnormality classification algorithm (red).

