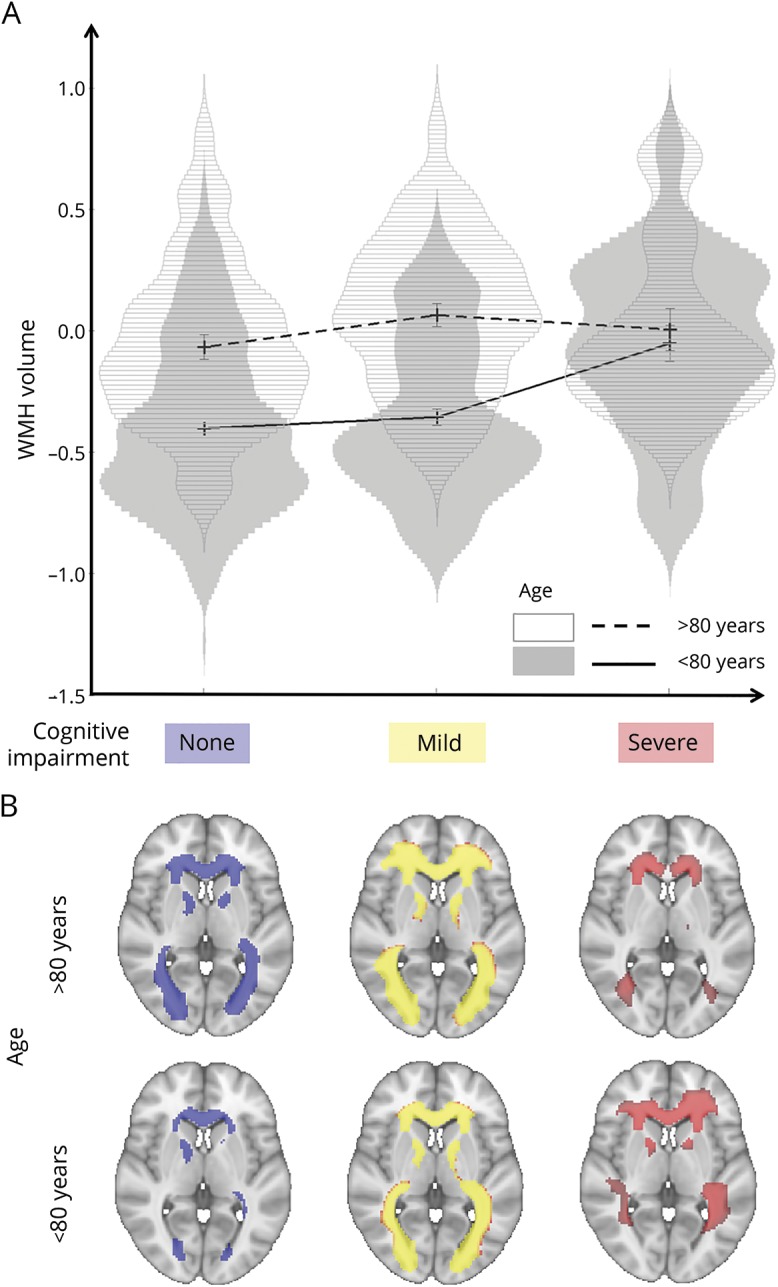
Figure 2. Age-related associations between white matter hyperintensity (WMH) volume and cognitive status.

(A) Violin plots of the adjusted, log-transformed WMH volumes for the 6 groups of interest obtained by dividing patients according to cognitive status and age. Error bars are ± 1 SD. (B) Average maps of WMH distribution for each group. First row, patients aged >80; second row, patients ≤80. Left: No cognitive impairment (CI). Middle: Mild CI. Right: Severe CI (neurovault.org/collections/2763/).
