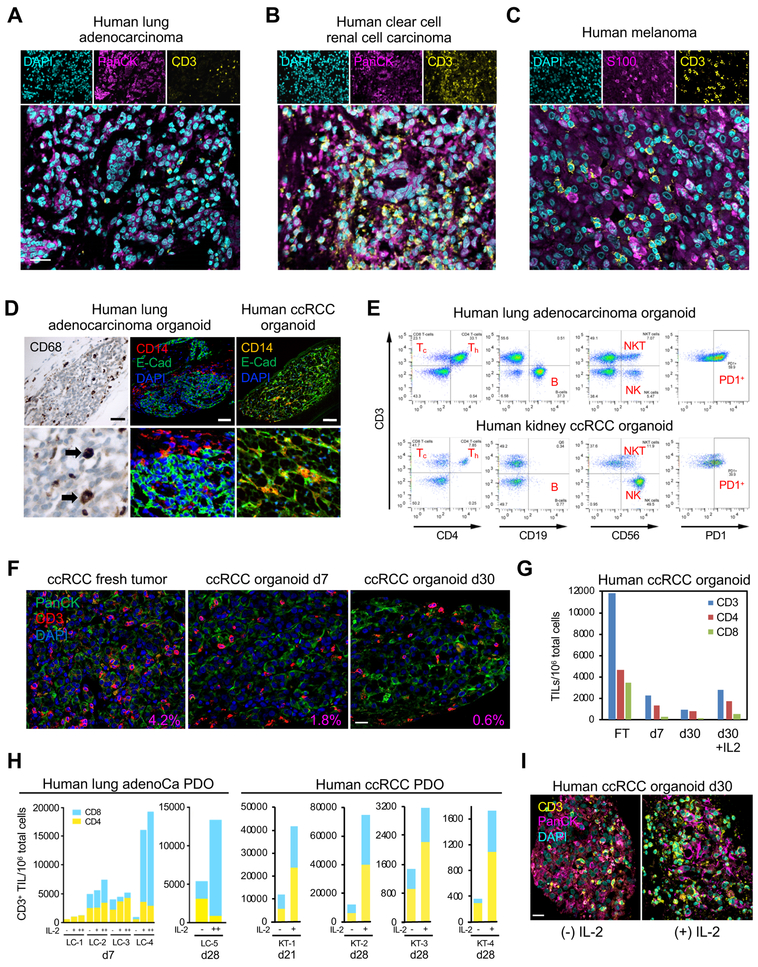
Figure 3. Immune components within human PDOs.
(A-C) IF staining of d14 PDOs from lung adenocarcinoma (A), clear cell renal cell carcinoma (ccRCC)
(B), and melanoma (C) identifies CD3+ TILs (yellow) closely associated with tumor epithelium (magenta, PanCK, S100), DAPI (cyan), scale bar = 25 μm.
(D) PDOs contain TAMs. PDO anti-CD14, E-Cad or CD68 IF staining in human clear cell renal cell carcinoma (ccRCC) (top) or human lung adenocarcinoma (middle, bottom). Scale bar = 50 μm.
(E) Diverse immune components upon FACS analysis of d7 lung adenocarcinoma and ccRCC PDOs.
(F) CD3+ TIL content in representative human ccRCC PDO in fresh tumor (d0) and culture days 7 and 30. PanCK (green) and CD3+ TIL (red) IF and DAPI (blue) co-stain. % area ratio of CD3+ cells indicated in red in the lower right corner. Scale bar = 20 μm.
(G) FACS quantitation of CD3, CD4 and CD8 TIL number/106 organoid cells from representative ccRCC PDO, +/− IL-2 for fresh tumor (FT) and culture d7 and d30.
(H) FACS analysis of IL-2-expanded organoid TILs. LC-1 – LC-4: independent lung NSCLC PDOs grown for 7d +/− IL-2. −, no IL-2; +, 600 IU/mL IL-2; ++, 6000 IU/mL IL-2. LC-5 and KT-1–4 (ccRCC) PDO-infiltrating T-cells persist at d21–28 without IL-2 but are significantly expanded with IL-2 (6000 IU/mL). ccRCC: d28 ccRCC PDO analyzed as in LC-1–5. Blue=CD8, Yellow=CD4.
(I) CD3+ TIL IF staining in representative d30 ccRCC PDO +/− IL-2 (100 IU/ml). CD3 (yellow), PanCK (magenta), DAPI (cyan). Scale bar = 20 μm.

