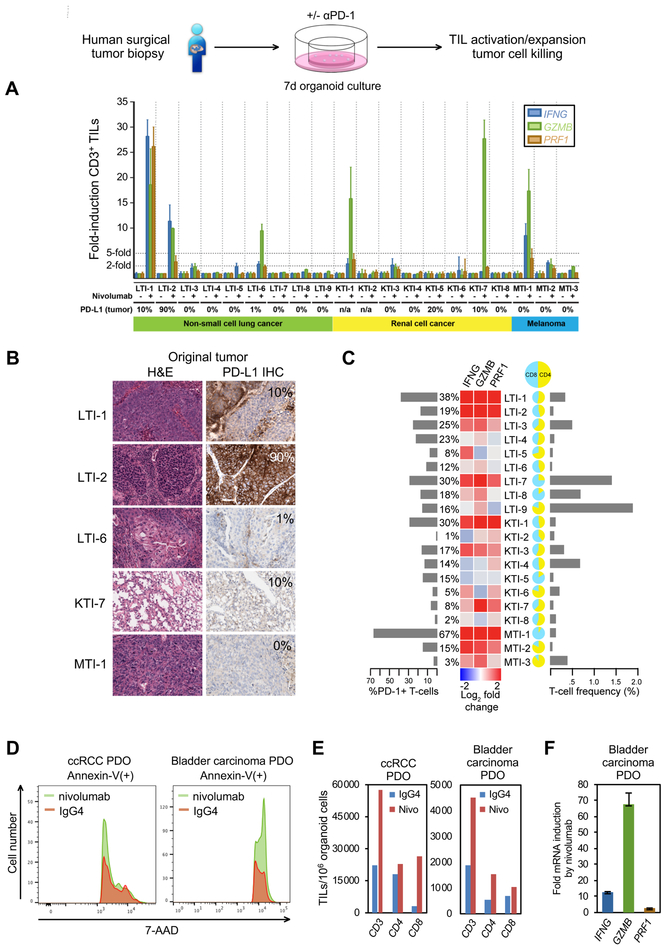
Figure 7. In vitro recapitulation of the PD-1-dependent immune checkpoint in PDOs derived from human surgical tumor resections.
(A) IFNG, GZMB, and PRF1 qRT-PCR of FACS-sorted CD3+ TILs from NSCLC, RCC and melanoma PDOs, after 7 days nivolumab or control IgG4 treatment, nivolumab-treated normalized to IgG4. 28–8 PD-L1 IHC % is depicted (n/a: original tumor not available for PD-L1 IHC), N=3 technical replicate determination. Error bars, +/− SEM.
(B) Clone 28–8 PD-L1 IHC of fresh tumor from PDO responders from (A). Original histology from a sixth responding PDO was not available for analysis.
(C) FACS T-cell profiling of PDOs versus qRT-PCR +/− nivolumab with % PD-1 T cells, % T cells per total viable organoid cells, and CD4:CD8 ratio.
(D) Anti-PD-1/nivolumab induction of PDO tumor epithelial cell death. 7-AAD FACS histogram of Annexin V(+) tumor epithelial cells. Human ccRCC or bladder urothelial carcinoma PDOs received nivolumab or IgG4 with anti-CD3 + anti-CD28 for 7 days.
(E) FACS analysis of CD3+, CD8+ and CD4+ PDO TILs per 106 organoid cells from (D).
(F) qRT-PCR of PRF1, GZMB and IFNG from FACS-sorted CD3+ PDO TILs from (D) as fold-change mRNA for nivolumab vs. IgG4 (all significant at P<0.001). N=3 technical replicates, error bars, +/− SEM.
See also Figures S6B–D, S7 and STAR Methods.

