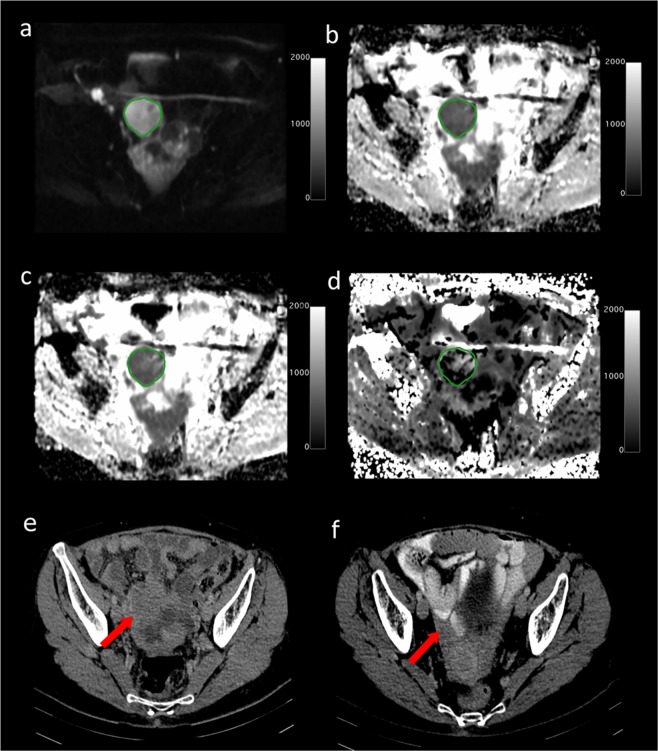
Figure 1.
Axial MRI images from a 63-year old high grade serous ovarian cancer patient who had a good response to neo-adjuvant chemotherapy. (a) DWI at b = 1300 s/mm2. Scale bar represents signal intensity; (b) ADC map with tumour ROI shown. Scale bar represents ADC in mm2/s × 1000; (c) Dapp map. Scale bar represents Dapp in mm2/s × 1000; (d) Kapp map. Scale bar represents Kapp × 1000; Axial CT scans following intravenous contrast medium: (e) before treatment; (f) after treatment, depicting a RECIST Partial Response (PR).

