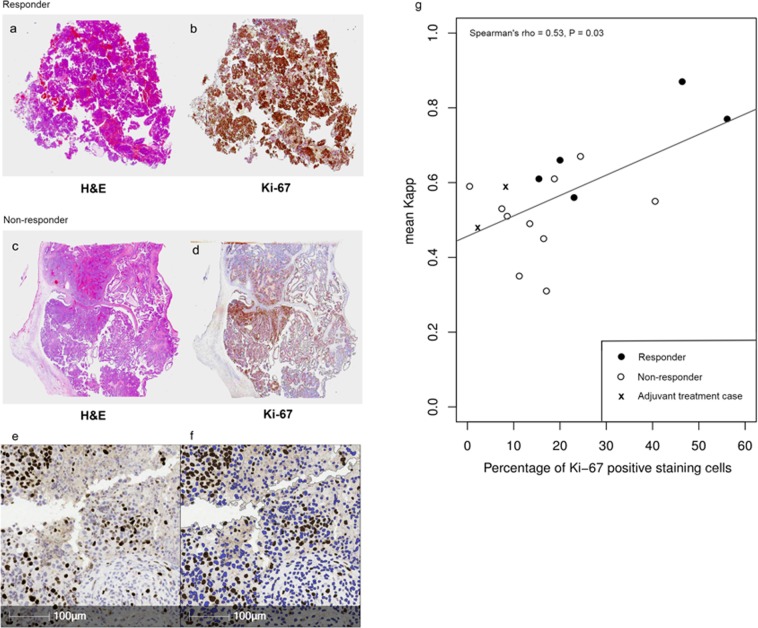
Figure 3.
Examples of histology from a responder and a non-responder. (a) 1x magnification H&E slide of responder; (b) 1x magnification Ki-67 staining from responder (positive tissue shown in brown and negative tissue shown in blue); (c) 1x magnification H&E slide of non-responder; (d) 1x magnification Ki-67 staining from non-responder (positive tissue shown in brown and negative tissue shown in blue); (e) 20x magnification of Ki-67 staining in a HGSOC patient, with positive cells in dark brown and background counter staining in blue; (f) automated image segmentation in Halo for quantification of Ki-67 staining. Positive cells are shown in dark brown and negative cells are shown in blue. (g) Scatterplot of mean tissue Kapp against percentage of cells positive for Ki-67 staining (optical density > 31). White circles indicate responders, black circles indicate non-responders and crosses indicate the two patients treated with primary surgery before starting adjuvant chemotherapy.

