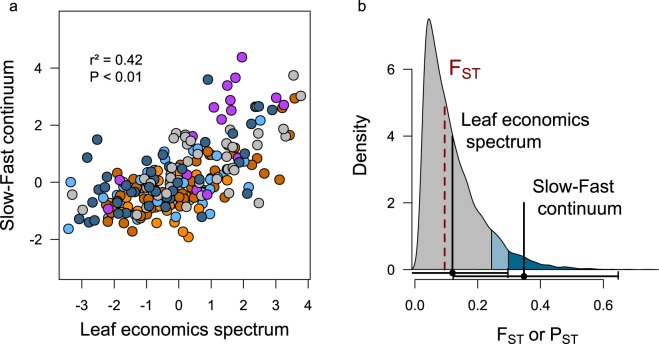
Figure 4.
The Leaf Economics Spectrum and the slow-fast continuum covariate in A. Thaliana and are differentiated among populations. (a) Correlation between the position of each genotype along the leaf economics spectrum and the slow-fast continuum. Colors represent the five genetic groups (see Fig. 1). (b) Phenotypic differentiation (PST, black vertical lines) and their confidence intervals (horizontal brackets) relatively to the distribution of genetic differentiation (FST), its median (red dashed line), 90th quantile (light blue) and 95th quantile (dark blue).

