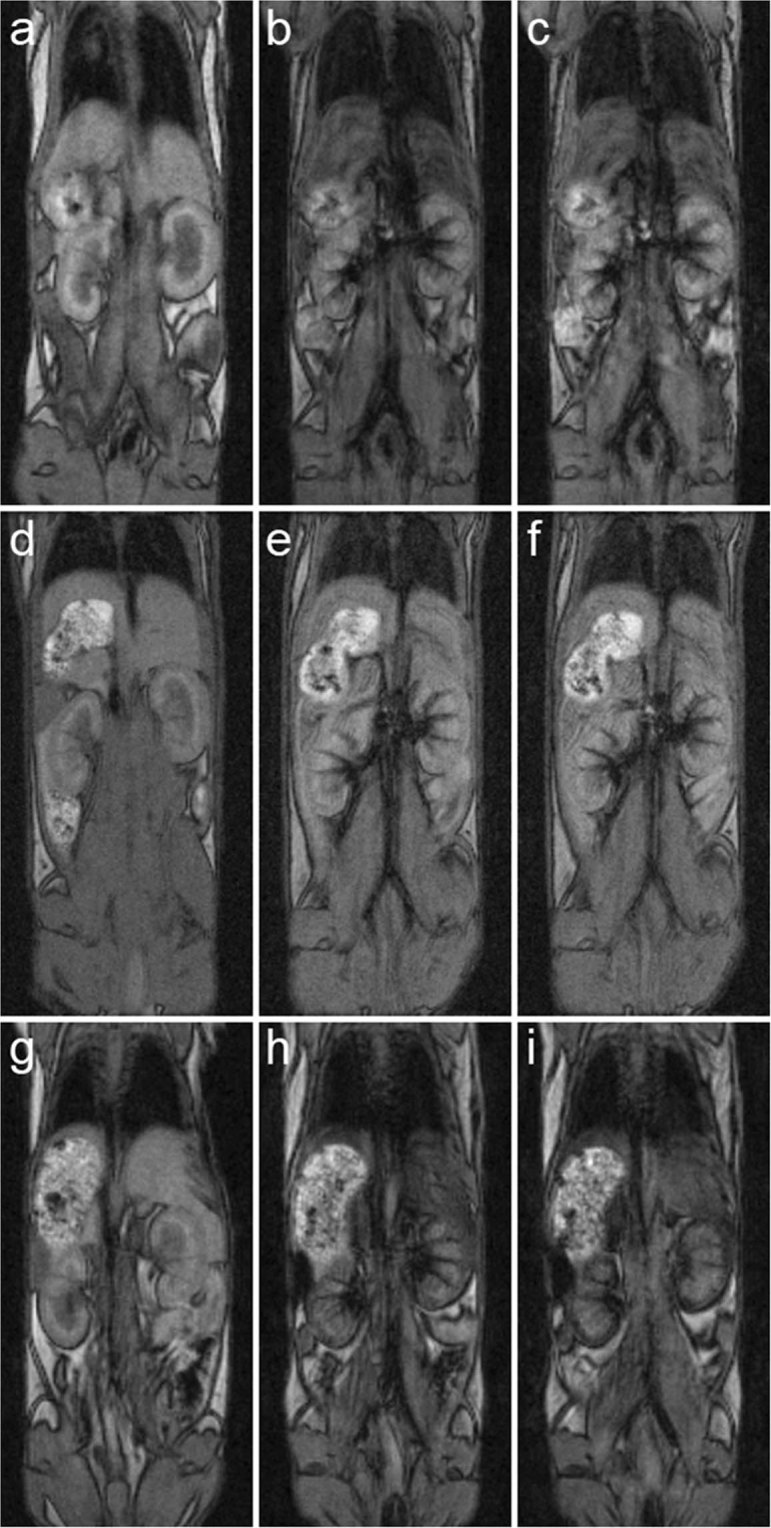
Figure 6.

MRI coronal images of mice (a,d,g) before application, (b,e,h) 10 min and (c,f,i) 60 min after application of (a–c) Fe3O4@PEG-Ner-10, (d–f) Fe3O4@PEG-Ner-20, and (g–i) Fe3O4@PEG-Ner-31 particles. High nanoparticle concentration in the blood after administration was manifested by a strong hypointense signal in the veins, clearly visible in the kidneys. Note also strong hypointense signal of (b,c) Fe3O4@PEG-Ner-10 and (g,h) Fe3O4@PEG-Ner-31 in the liver caused by faster clearance via the liver and weak hypointense signal of (e,f) Fe3O4@PEG-Ner-20 in the liver caused probably by slower clearance and thus prolonged blood circulation time. Images were obtained by a gradient echo sequence with weak T2* weighting.
