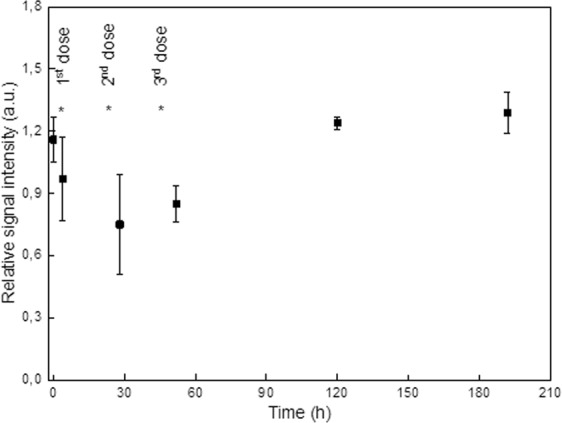
Figure 9.

MRI of mice with EL-4 tumor. Dependence of relative signal intensity of the contrast in the tumor on time after the first Fe3O4@PEG-Ner-20 particle application. The asterisks show time points of nanoparticle administration. Signal intensity at time points 28 and 52 h (i.e., after the second and third nanoparticle administration) are significantly lower (t-test, p < 0.05) than that at time 0 (before nanoparticle administration) or at time points 120 and 192 h.
